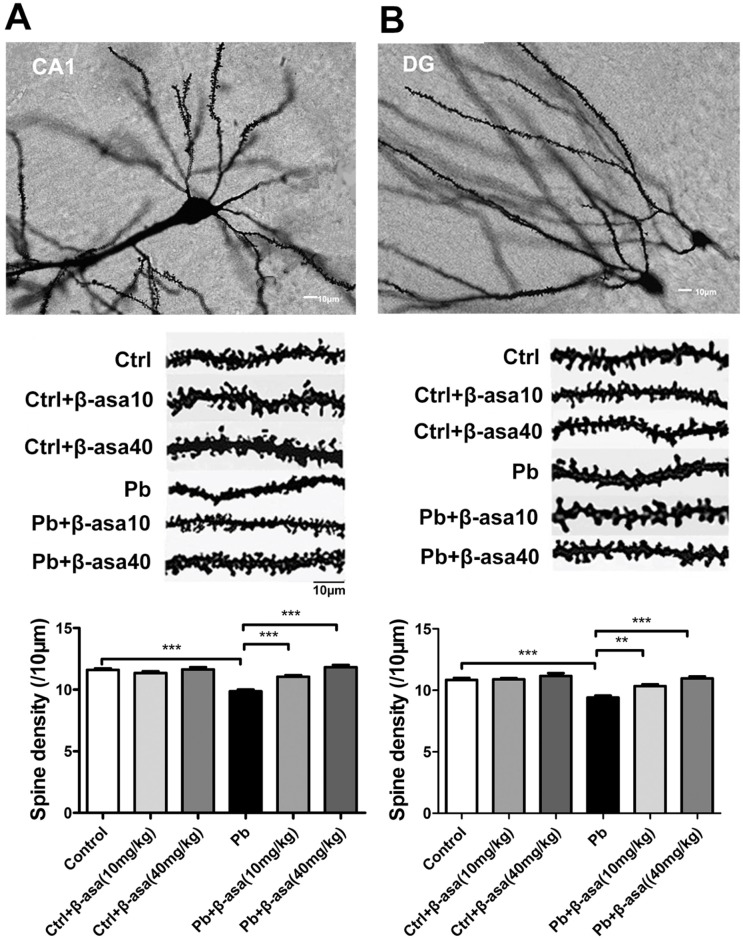
Fig 3. Effects of β-asarone on dendritic spine density in Pb-exposed developmental rats.
(A) CA1 area; (B) DG area. The top: Representative Golgi-Cox staining of dendritic arborization and dendritic spine density. The middle: Representative dendritic shaft with spines of hippocampal neurons. Scale bar = 10μm. The bottom: Histogram reports the quantification of spine density (10μm). (**P<0.01, ***P<0.001, n = 8 per group; β-asa: β-asarone, the same in the following Figs).

