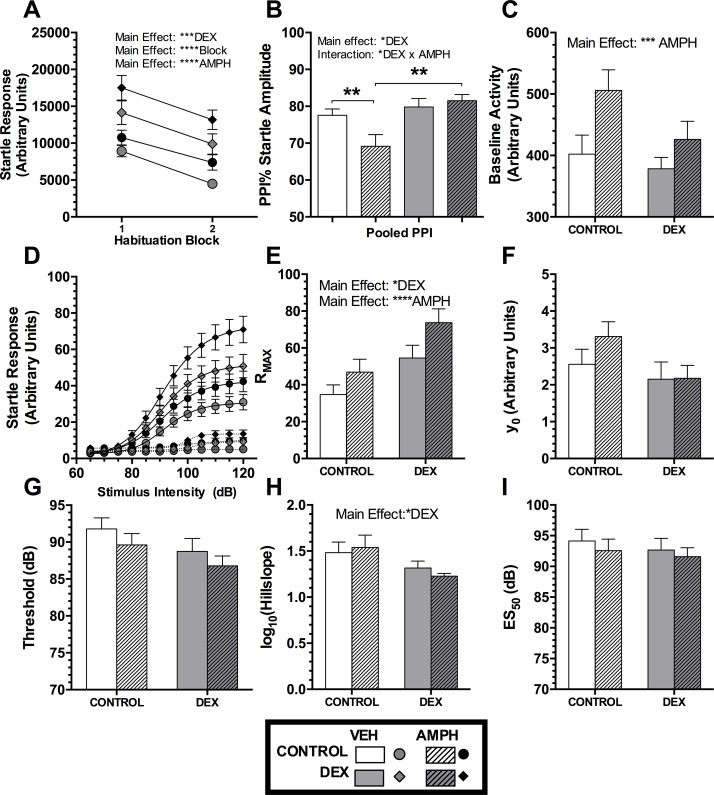
Fig 2. Results from the prepulse inhibition of the startle reflex experiments.
The habituation block of trials at the beginning and end of the experiment A) startle response to the habituation trials and B) the PPI response with and without dexamphetamine (AMPH). C) The baseline activity without startle pulses. D) The group average stimulus intensity–response magnitude curves for the startle response trials, with prepulse (dotted lines) or without prepulse (solid lines) curve fits. The parameters from curve fits to the startle only condition are shown in E) to I). E) RMAX is the predicted maximum startle response and F) y0 is the theoretical minimum startle response. G) The Threshold of sound intensity required to elicit a startle response. H) the logarithm of Hillslope, which is a measure of maximum velocity of the curve, where acceleration is 0. I) ES50 the fitted value where startle response is half of maximum. Data were analysed using mixed model 3 or 2-way ANOVAs, as appropriate. Main effects of Dexamethasone treatment (DEX), Habituation block (Block), Amphetamine treatment (AMPH) and interactions are indicated by text within each panel. Bars show means and SEM. Comparison bars show post-hoc analysis Holm-Bonferroni t-tests. Significance values: *p<0.05, **p<0.01, ***p<0.001, ****p<0.0001.

