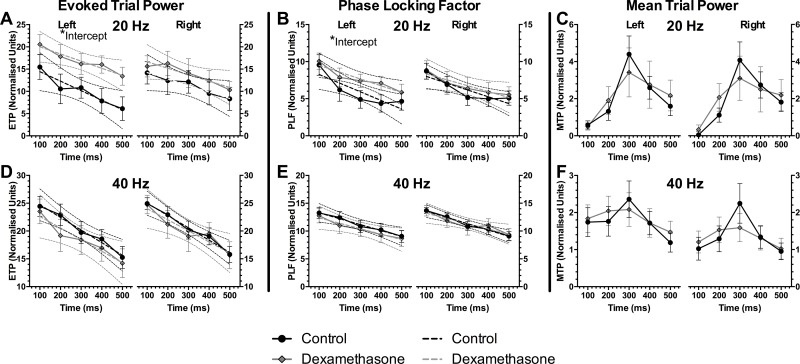
Fig 5. Auditory steady-state response (ASSR) outcomes.
Evoked trial powers (ETP, A & D), phase locking factors (PLF, B & E) and mean trial powers (MTP, C & F) to ASSR stimulus trains at 20 Hz (top row) or 40 Hz (bottom row). Left axes for each panel shows recordings from the left auditory cortex, and right axes from the right side. Dotted lines indicate confidence linear regression curve fits, error bars show ± SEM, significant differences between groups: * p<0.05. Analysis for ETP and PLF used regression statistics whilst MTP used 2-way ANOVAs.

