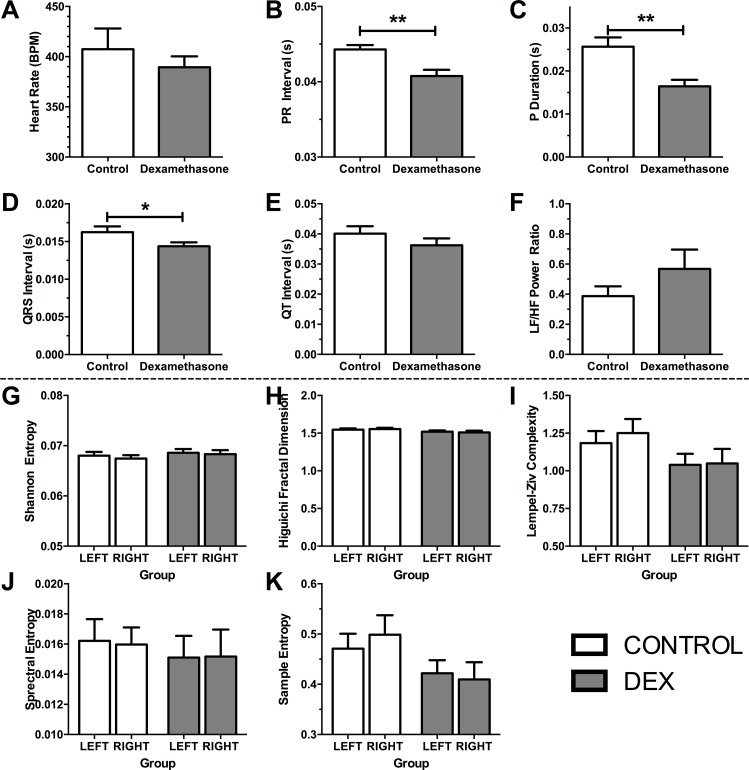
Fig 6. ECG (top panels) and EEG outcome measures (bottom panels).
Top panels: Measures of heart function from 10 min ECG trace. A) Heart rate beats per min, B) PR Interval, C) P duration, D) QRS Interval, E) QT Interval, F) Heart rate variability Low Frequency / High Frequency ratio. Definitions: Beats per minute, BPM; Low Frequency / High Frequency Power Ratio, LF/HF Power Ratio. Analysis using 2-tailed t-tests. Bottom panels: Complexity and entropy analysis of EEG data from the left are right auditory cortex. G) Shannon Entropy, H) Higuichi Fractal Dimension, I) Lempel-Ziv Complexity, J) Spectral Entropy, and K) Sample Entropy. Bars show mean + SEM. Significant differences: * p<0.05, **p<0.01.

