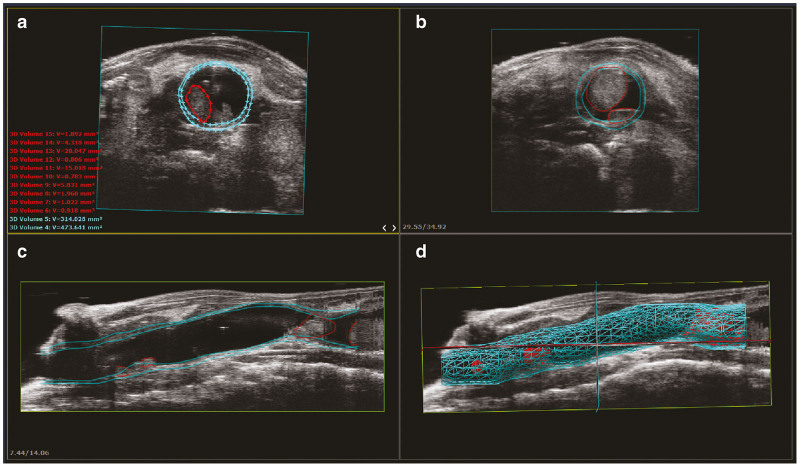
Figure 3.
Display options of 3D reconstructed data. The VevoLAB software provides multiple viewing options of 3D reconstructed data renderings. (a) An example transverse colon slice with user-defined regions of interest (ROI) of colon walls (light blue) and tumor (red). Individual ROI volumes are available as export from the software enabling the user to quantify individual tumors or perform summation for total tumor load or colon wall load. (b) An example extrapolated transverse layer ROI applied by the software. (c) An example sagittal layer ROI produced by assemblage of the individual transverse layer ROIs. The anal end is shown at the left of the screen window. (d) A final 3D reconstruction depicting all applied ROIs with the ultrasound data overlay visible around the reconstructed colon.

