
Figure 4.
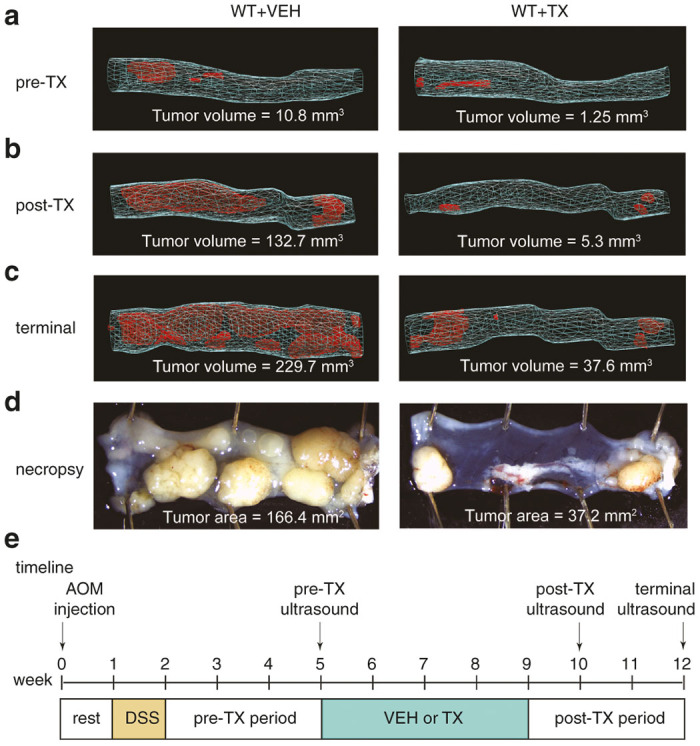
3D reconstructions of colons provides a quantitative measurement of tumor dynamics with and without treatments. All time-points represent WT animals challenged with azoxymethane (AOM)/dextran sodium sulphate (DSS) to induce colorectal cancer 5 weeks prior to the beginning of treatment with Treatment X (TX) or Vehicle (VEH). The anal-end is depicted at right in each image. (a) Prior to beginning TX or VEH, colons exhibited a small tumor volume load (VEH = 10.8 mm3, TX = 1.25 mm3). (b) Treatment for 5 weeks, resulted in a reduced tumor volume load compared with the VEH treated mouse (VEH = 132.7 mm3, TX = 5.3 mm3). (c) At termination, 7 weeks after beginning treatment, the animal given TX showed a dramatic difference in total volume load (VEH = 229.7 mm3, TX = 37.6 mm3). (d) Segment-matched photographic images of the mid and distal colon at necropsy with associated tumor areas (VEH = 166.4 mm2, TX = 37.2 mm2). (e) Diagram represents a timeline of the treatment paradigm.