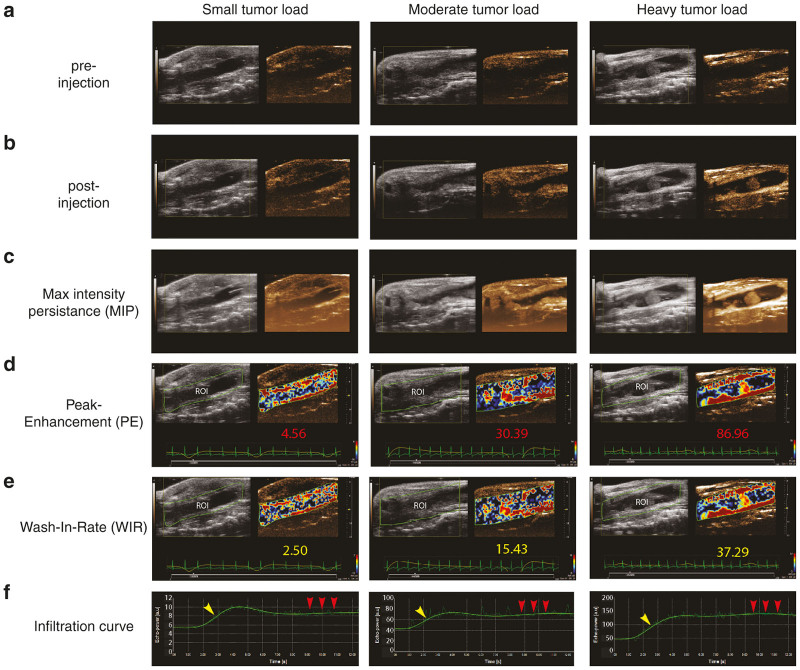
Figure 5.
2D Non-linear contrast mode enables calculation of relative blood volume and perfusion of the distal colon using intravenous nontargeted microbubbles. (a) 2D B-mode micro-ultrasound image of sagittal view prior to injection of microbubbles in three distal colons with disparate tumor loads (small, moderate, and heavy). (b) 2D B-mode micro-ultrasound image of sagittal view of the distal colon after the injection of microbubbles. (c) Maximum intensity persistence (MIP) providing enhanced visualization of microbubble perfusion indicating areas of vascularization. (d) The Peak Enhancement (plateau of the microbubble infiltration curve) provides quantification of relative blood volume. Quantified values for each of the colons is shown in red (small = 4.56 a.u., moderate = 30.39 a.u., heavy = 86.96 a.u.). (e) The wash-in-rate (slope of the microbubble infiltration curve) provides quantification of the relative blood perfusion. Quantified values for each of the colons is shown in yellow (small = 2.50 a.u., moderate = 15.43 a.u., heavy = 37.29 a.u.). (f) Microbubble infiltration curves for each of the colons. Note that the arbitrary unit (a.u.) y-axis scales are dramatically different between the three disparate tumor loads. The curve signatures are homologous indicating consistent kinetics between animals.

