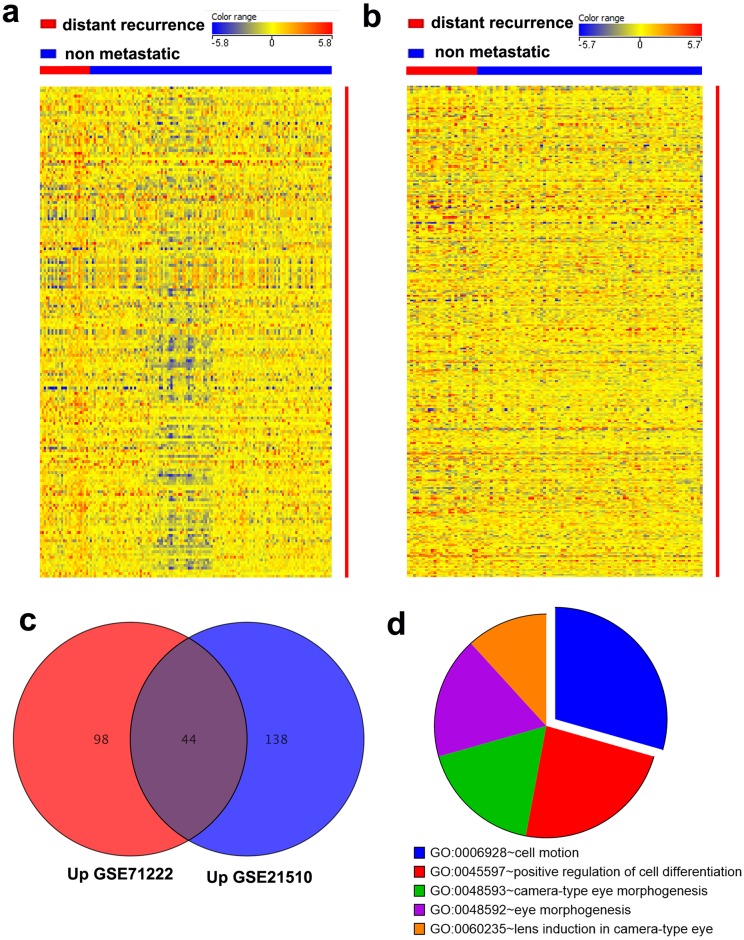
Fig 1. Genes associated with CRC distant recurrence (DR).
Heatmap depicting the expression levels of differentially expressed genes (1.5 fold changes and P ≤ 0.05) between DR and non-recurrent (NR) CRC patients from the GSE71222 (a) and GSE21510 (b) datasets. Each column represents an individual sample and each row represents a single transcript. The expression level of each mRNA in a single sample is depicted according to the color scale. (c) Venn diagram depicting the common upregulated genes between DR and NR CRC samples from the GSE71222 and GSE21510 datasets. (d) Pie chart illustrating the distribution of the top 5 pathway designations for the 44 common upregulated transcripts from (c). The pie size corresponds to the number of matched entities.

