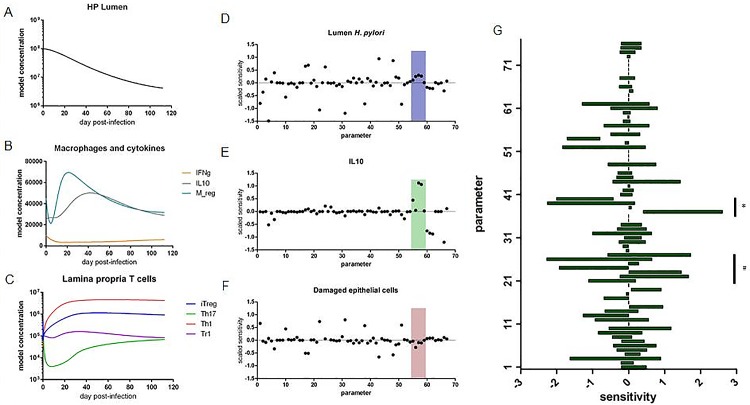
Fig 2. Simulation and analysis of Helicobacter pylori colonization.
Time course simulation with calibrated H. pylori-host interaction model displaying H. pylori burden (A), macrophage and cytokine responses (B) and T cell responses (C). Local sensitivity analysis of model displaying positive and negative effects of parameters on model species H. pylori (D), IL10 (E), damaged epithelial cells (F). Boxed region contains parameters associated with Mreg model species. Specific model species of interest are indicated by symbols: & marks column associated with HP model species, * marks column associated with IL10 model species and # marks column associated with Edamaged model species. Global sensitivity analysis displaying parameter sensitivity ranges on the differentiation of regulatory macrophages (G). Parameters associated with cytokines are indicated by (*) and parameters associated with H. pylori are indicated by (#).

