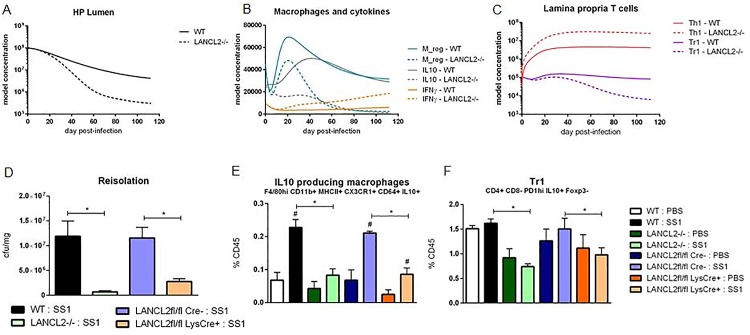
Fig 5. Simulation and validation of the effects of LANCL2 loss on the response to Helicobacter pylori colonization.
Simulated time course effects of LANCL2 knockout on H. pylori burden (A), macrophages and cytokines (B), and lamina propria T cells (C). Bacterial re-isolation of H. pylori from stomachs of wild-type (black), LANCL2-/- (green), LANCL2fl/fl; LysCre- (blue) and LANCL2fl/fl; LysCre+ (orange) mice at week three post-infection (D). Percentage of IL10+ CX3CR1+ CD64+ MHCII+ CD11b+ F4/80hi macrophages (E) and IL10+ FOXP3- PD1hi type 1 regulatory T cells (F) at week 3 post-infection in wild-type, LANCL2-/-, LANCL2fl/fl; LysCre-, and LANCL2fl/fl; LysCre+ mice. p-values less than 0.05 are considered significant and marked by an asterisk (*) for genotype differences and a pound sign (#) for treatment differences within genotype, (n = 7).

