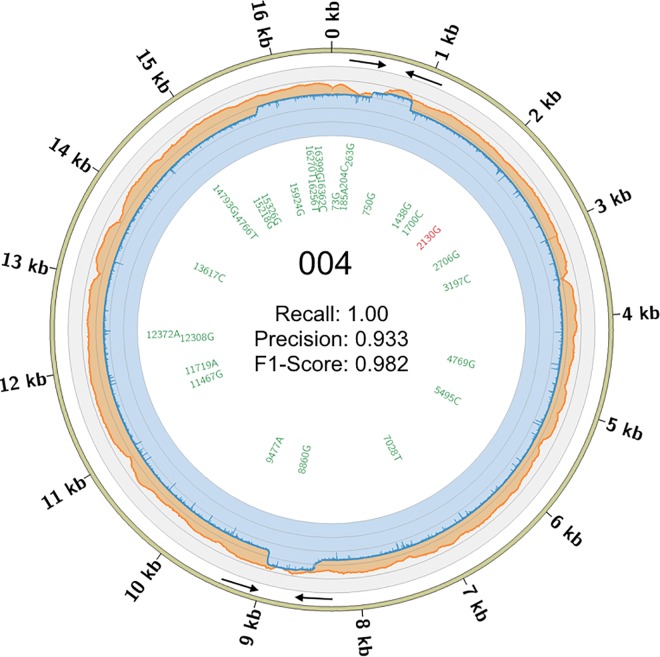
Fig 3. Coverage and Concordance Circos for 004.
The coverage depth per base is shown for the MiSeq (orange) and MinION (blue) shown on the outer ring using a log10 scale. The inner ring shows concordance at each SNP using a MiSeq VAF of 0.90 and a MinION VAF of 0.65. Text color denotes the categorization of each SNP under the VAF combination providing the highest concordance (F1-Score). Green text indicates true positives and black text is for false negatives present in the MinION call sets. See S2 and S3 Figs for similar plots of 005 and 047, respectively. Black arrows indicate the locations and orientations of the primers used for amplification.

