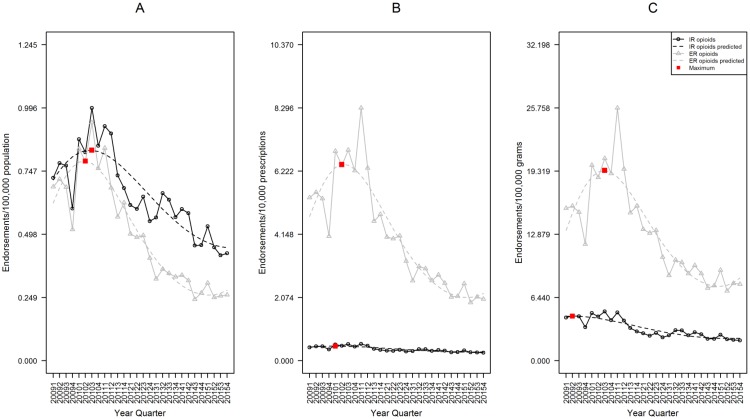
Fig 4. Rates of IR and ER opioid analgesic endorsement, RADARS Opioid Treatment Program.
Data are displayed according to calendar quarter. (A) Rates of endorsement adjusted for population. (B) Rates adjusted for prescriptions dispensed. (C) Rates adjusted for grams dispensed. For each, a cubic model was fit for both IR and ER formulations over time. The red boxes represent the point with the highest expected rate during the study period.

