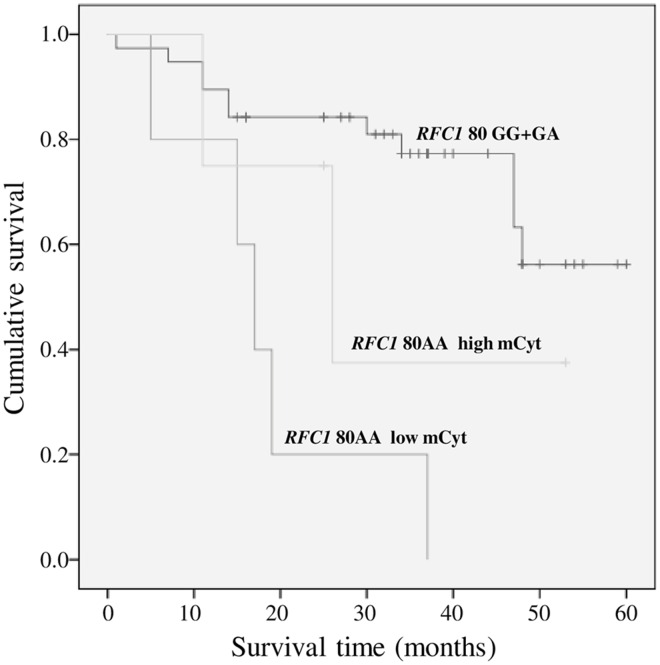
Fig 2. Survival curves plotted by Kaplan-Meier analysis according to RFC1 80G>A genotypes and mCyt levels.
RFC1 80AA patients with low mCyt levels (≤5.34%) were associated to a lower survival as compared to carriers of the RFC1 80G allele (71.1%) (p<0.0001). The comparison between RFC1 80G carriers and RFC1 80AA with high mCyt (>5.34%) was not statistically significant (p = 0.919), as it was the comparison between RFC1 80AA with low mCyt and with high mCyt (p = 0.209).

