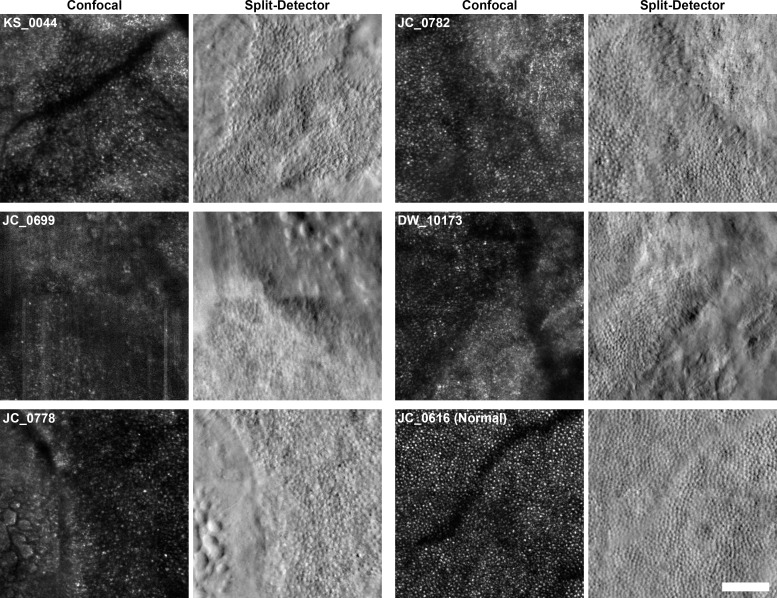
Fig 2. Split-detector AOSLO imaging allows unambiguous imaging of photoreceptors and lesions borders.
Regions bordering areas of atrophy are shown here for all 5 subjects who were imaged using both confocal and split-detector AOSLO. Confocal images of 400 x 400 μm regions of interest (ROIs) are shown beside split-detector images of the same areas. Subjects and modalities are labeled. Confocal and split-detector images from a normal male, JC_0616, are shown for comparison. The ROIs are located at the following eccentricities: KS_0044, 3780 μm; JC_0699, 1432 μm; JC_0778, 2772 μm; JC_0782, 3050 μm; DW_10173, 1883 μm; JC_0616, 1899 μm. Note that confocal images often present confounding ambiguities in pathology: lesion borders are poorly defined, and abnormal cone reflectivity cannot be clearly distinguished from the reflectivity arising from rods, debris, and/or atrophic retina. In contrast, split-detector images offer superior delineation of lesion borders and unambiguous imaging of cone inner segments. Rods can be seen between cones in 4 of 5 cases (all but JC_0699). Scale bar: 100 μm.

