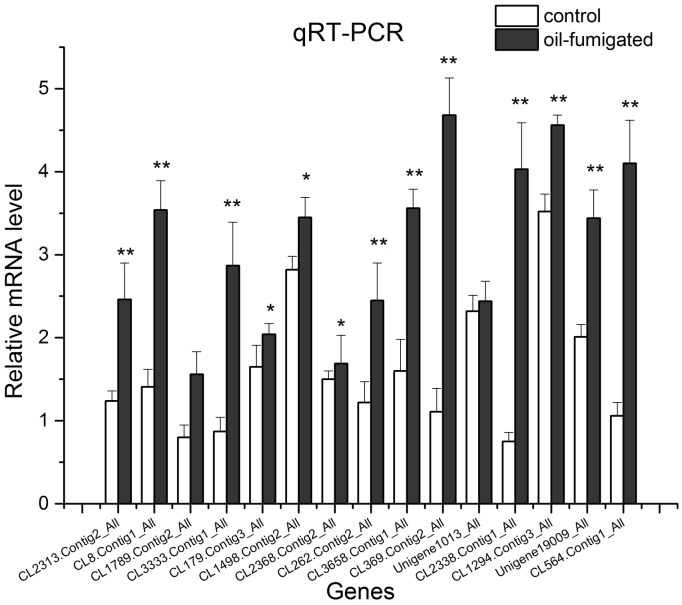
Fig 4. Real-time qRT-PCR analysis of DEGs encoding respiration and detoxification-related enzymes in S. zeamais after oil-fumigation.
The gene expression (mean ± SD) quantified as a relative fold change was carried out using the 2−ΔΔCT method. The asterisks indicate significant differences in the expression level of DEGs between oil and no-oil treated samples (* p value < 0.05 and ** p value < 0.01).

