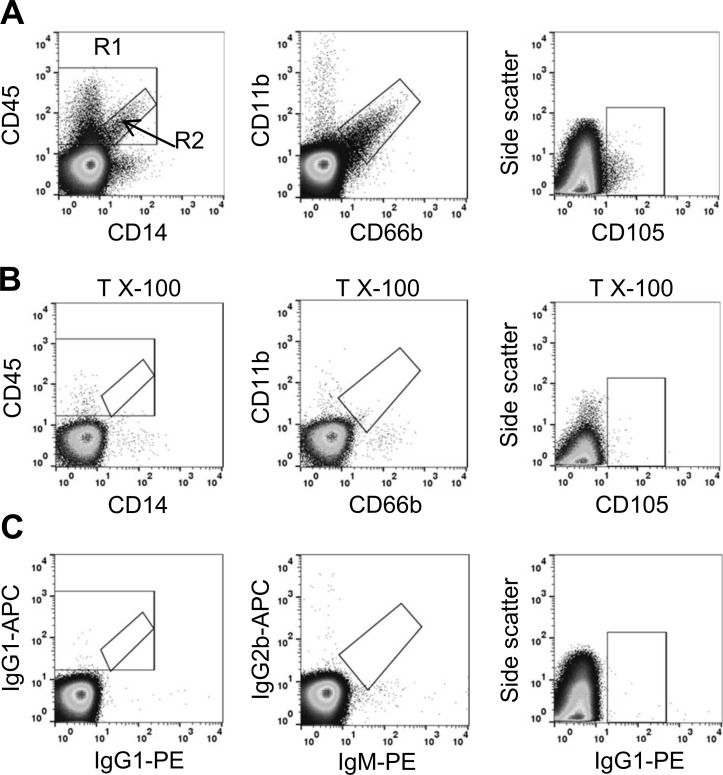
Fig 2. Flow cytometric identification of MV sub-types.
Dots plots of burns patient plasma stained for MVs using fluorophore-conjugated monoclonal antibodies to cell-surface markers (A). Plots show events that have been gated on forward light scatter using 1.3 μm calibration beads to define the upper size limit. For CD45/CD14 MV analysis, total CD45+ events are shown in the larger region 1 (R1) and CD45+/CD14+ events in the smaller sub-region 2 (R2). MV identification is confirmed by sensitivity to detergent lysis (Triton X-100, 0.1%)(B). Matched antibody isotype and fluorophore control plots are shown for comparison (C).

