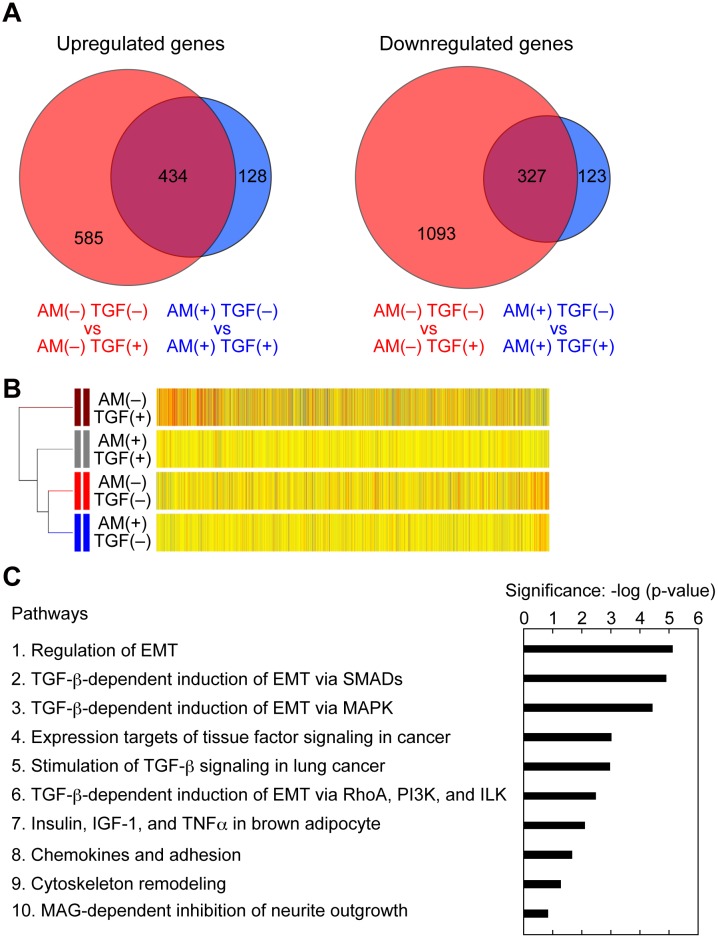
Fig 7. AM251 inhibits EMT with specificity.
(A–C) RPTEC cells were incubated with or without 2 ng/ml TGF-β1 (TGF) in the presence or absence of 10 μM AM251 (AM) for 24 h. Total RNA was isolated from three independent samples, pooled, and subjected to microarray analyses. (A) Comparison of the microarray data was conducted on the data from AM251(−) TGF-β1(−) versus those from AM251(−) TGF-β1(+) conditions (red circles); and from AM251(+) TGF-β1(−) versus those from AM251(+) TGF-β1(+) conditions (blue circles). Numbers of upregulated (≥2-fold; left panels) and downregulated (≥2-fold; right panels) genes are depicted as Venn diagrams. (B) Hierarchical clustering analyses were performed using genes upregulated by ≥2-fold upon treatment with TGF-β1 by the centroid distance method. Yellow bars indicate that the values are similar to the averages of four different conditions. Red and blue bars indicate that the values are higher and lower than the averages, respectively, with the color strengths representing the degrees of the values. (C) Enrichment pathway analyses were conducted using genes with ≥2-fold change upon treatment with TGF-β1 and the MetaCore gene regulatory network database. The top 10 pathways are shown. PI3K, phosphoinositide 3-kinase; ILK, integrin-linked kinase; IGF, insulin-like growth factor; TNFα, tumor necrosis factor α; MAG, myelin-associated glycoprotein.

