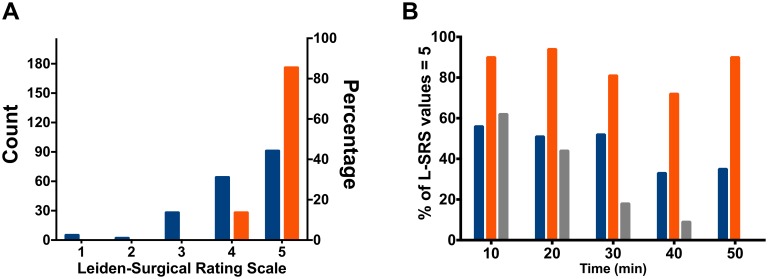
Fig 3. Distribution of L-SRS scores.
A. Distribution of the individual Leiden-surgical rating scale (L-SRS) scores across the 5 possible categories (see Table 1). B. Percentage of L-SRS values of 5 over time in single, moderate and deep blocks. Orange depicts deep NMB, blue moderate NMB and grey single NMB.

