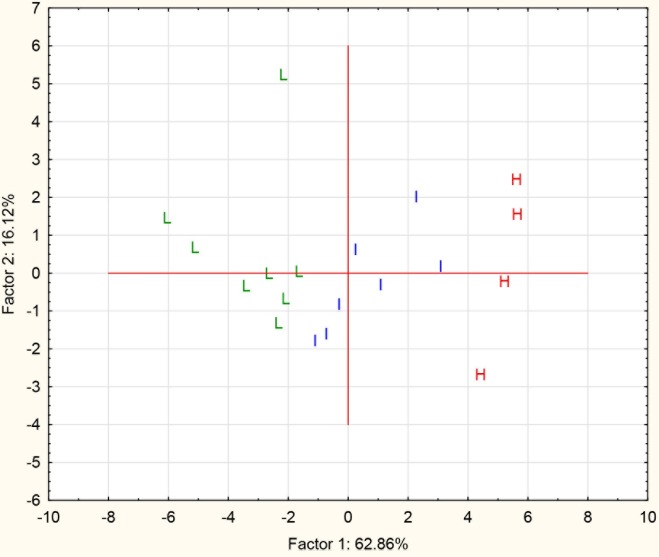
Fig 3. The scatterplot of the principle component analysis (PCA) scores (factor 1 vs factor 2) of the amino acid composition profiles in sweat from the combined study cohort (n = 19).
The scores for each of the participants have been coded for membership of one of the three clusters: L = low, I = intermediate, H = high.

