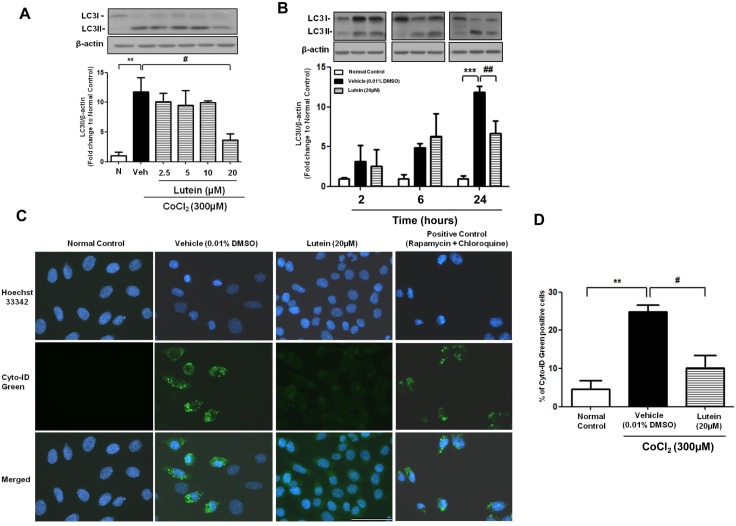
Fig 5. Lutein protected rMC-1 cells from CoCl2-induced autophagy.
Western blot analysis of expression of an autophagic marker, LC3II, along with the densitometric quantification (normalized by β-actin). (A) rMC-1 cells were exposed to CoCl2 (300μM) together with various concentration of lutein for 24 hours. LC3II expression was up-regulated upon CoCl2-induced hypoxia and attenuated by 20μM of lutein. (B) Expression of LC3II was up-regulated 2 hours after CoCl2 treatment and continued to increase in the remaining time points. Lutein was able to attenuate LC3II expression at 24 hours after hypoxic challenge. (C) Autophagosome formation was monitored in rMC-1 cells 24 hours after CoCl2 treatment. Both normal control and treated cells were stained with Cyto-ID® green dye and Hoechst 33342. Representative fluorescence microscopy images exhibited a decreased number of green fluorescence-labeled autophagosomes in lutein-treated cells when compared with that in vehicle-treated cells. Rapamycin and chloroquine co-treatment in rMC-1 cells were used as the positive control to identify the presence of autophagosome in the cells. (D) Quantification of Cyto-ID® green positive cells. Data was presented as the percentage of Cyto-ID® green positive cells over the total number of cells counted. n = 4 in each group. **P< 0.01, ***P<0.001 versus normal control group; #P<0.05, ##P<0.01 versus vehicle-treated group. Scale bar, 50 μm.

