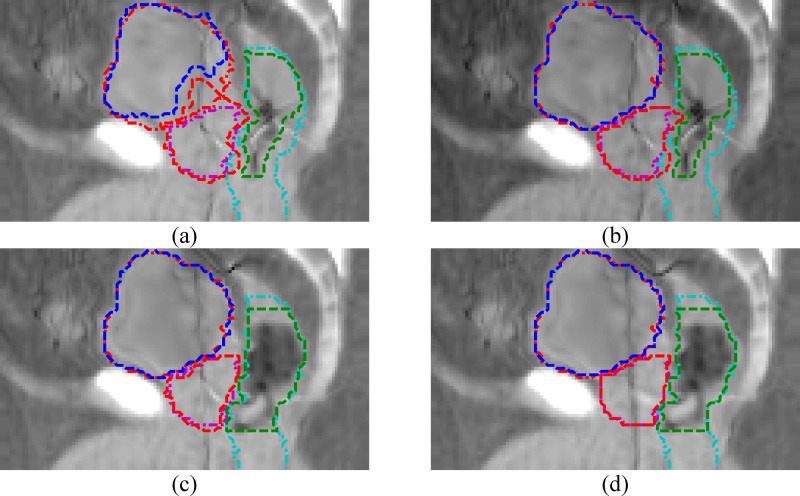
FIG. 7.
Comparison of step one registration results for the same patient used in Figs. 2, 4, and 5, and Table IV in different ways of using MVCT structure contours for image intensity manipulation. The images are the deformed MVCT images after registration. The dash-dot lines are the kVCT contours. The dashed lines are the deformed MVCT contours. (a) Without intensity manipulation. (b) Intensity manipulation only on the bladder. (c) Only on the bladder and the rectum. (d) On the bladder, the rectum, and the prostate.

