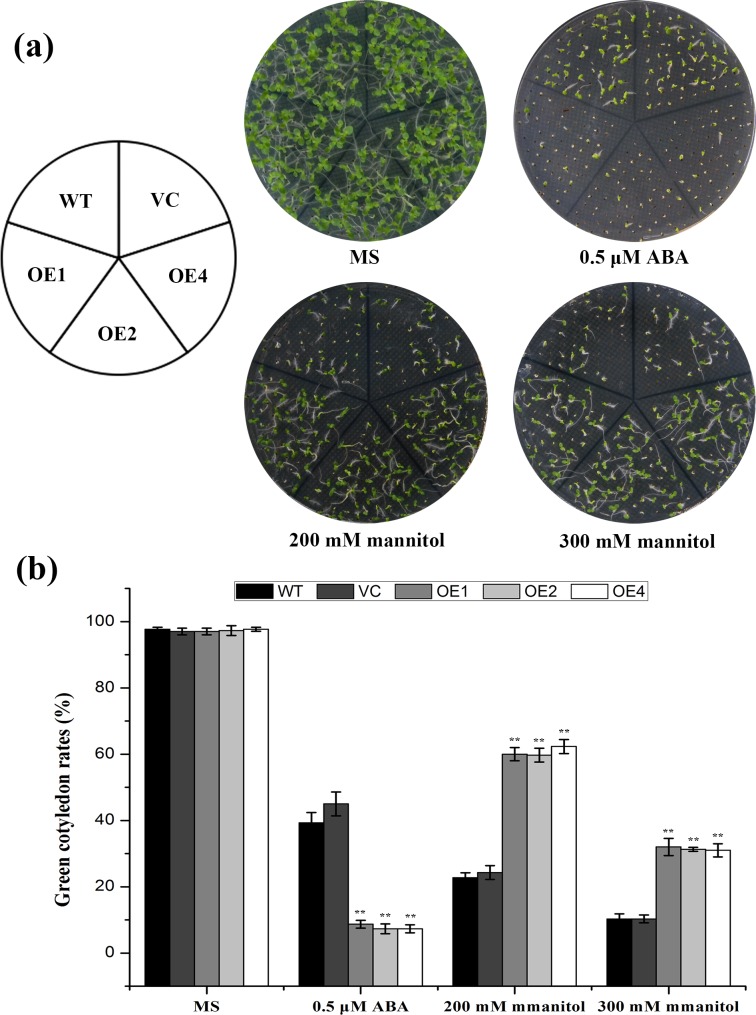
Fig 8. The analysis of green cotyledon rates in the controls (VC and WT) and TaCIPK2-overexpressing lines at early developmental stages.
(a) The controls and the T3 generation of TaCIPK2-overexpressing tobacco seeds were germinated on MS media with or without 0.5 μM ABA, 200 mM mannitol and 300 mM mannitol and photographed after two weeks. (b) The green cotyledon rates were counted after germination. Vertical bars indicate ± SD calculated from three independent biological replicates with similar results.

