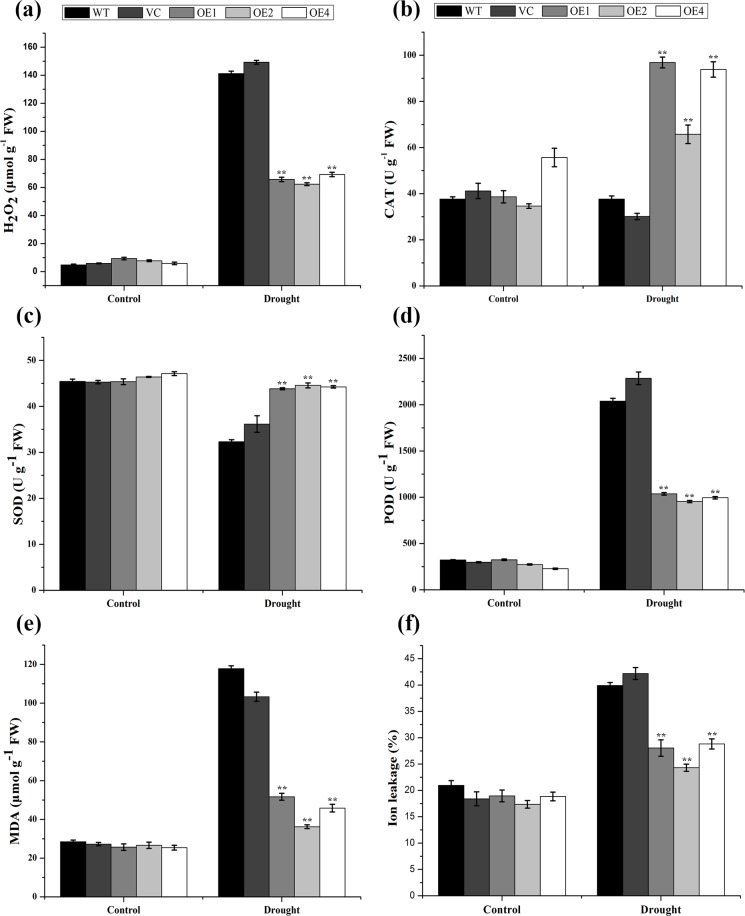
Fig 9. Physiological indices of control and TaCIPK2-overexpressing transgenic plants under drought stress conditions.
Analysis of H2O2 content (a), CAT (b), SOD (c), and POD (d) activities, MDA content (e) and ion leakage (f) in control and TaCIPK2-overexpressing (OE) lines under normal and drought stress conditions. Values shown are means ± SE of three replicates. Asterisks indicate statistically significant differences from control (**P < 0.01).

