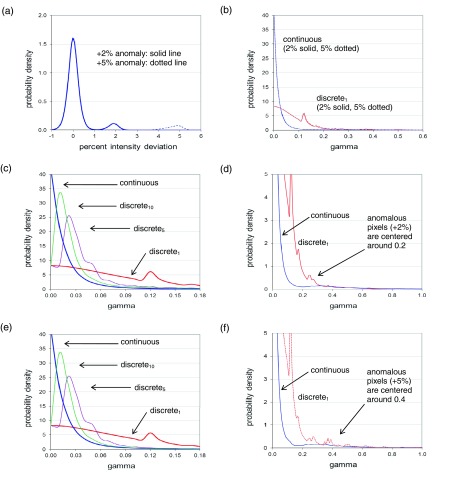
FIG. 4.
For the dynamic field of Fig. 1(a), aggregate 6 MV PID and gamma distributions with respect to a mean reference image, for registered images into which 53 × 53 pixel +2% and +5% anomalies are inserted at random locations. (a) Aggregate GSPID distribution. (b) Aggregate continuous and discrete gamma distributions. (c) For +2% anomalies, aggregate gamma distributions with discrete gammas (denoted discreten) calculated on progressively finer grids of n = 1, 5, and 10 sub-pixels per original pixel. (d) Same as c, but on an expanded scale. (e) For +5% anomalies, aggregate gamma distributions. (f) Same as e, but on an expanded scale. These results show that anomalies are more readily detectable (by eye) in the PID distributions than in the gamma distributions.

