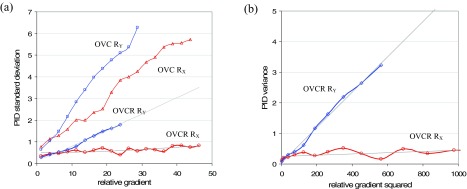
FIG. 5.
Gradient results for the dynamic field of Fig. 1(a) shot at 6 MV. (a) Plots of PID SD versus relative gradients RX in the x/jaw direction and RY in the y/leaf direction, for 6 MV patient field images that are for 6 MV patient field images that are output variation corrected but not registered (OVC) and output variation corrected and registered (OVCR). To generate these plots, PIDs are calculated for the 57 OVC or OVCR images, and binned according to the pixel's RX or RY value. The SD is then calculated per bin. (b) Plots of PID variance versus and for 6 MV OVCR patient field images.

