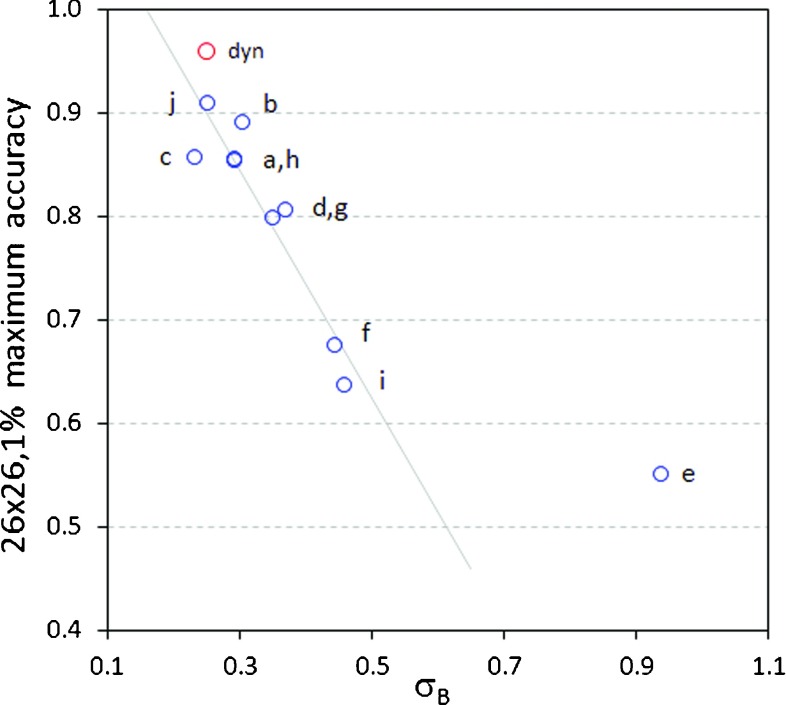
FIG. 9.
Plot of the maximum detection accuracy achieved for 26 × 26, 1% anomalies, as a function of the measured baseline noise parameter σB. The red point represents the accuracy achieved for the dynamic field of Fig. 1(a). Blue points are for the step-and-shoot fields of Fig. 2. All fields except the outlier 2(e) exhibit a linear relationship between detection accuracy and σB.

