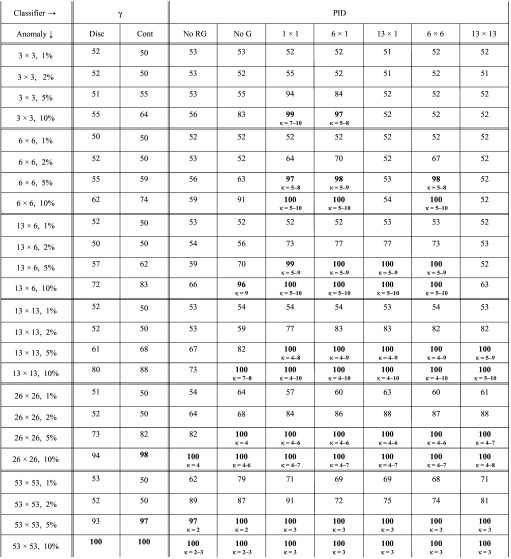
TABLE IV.
Maximum classification accuracy for anomalies of varying sizes inserted into 6 MV dynamic field images, when PID and gamma values are calculated with respect to a reference image that is the first of the measured images. Small text in the lower half of each cell gives the optimum range for parameter κ. Cells with maximum accuracy ≥95% are in bold.

