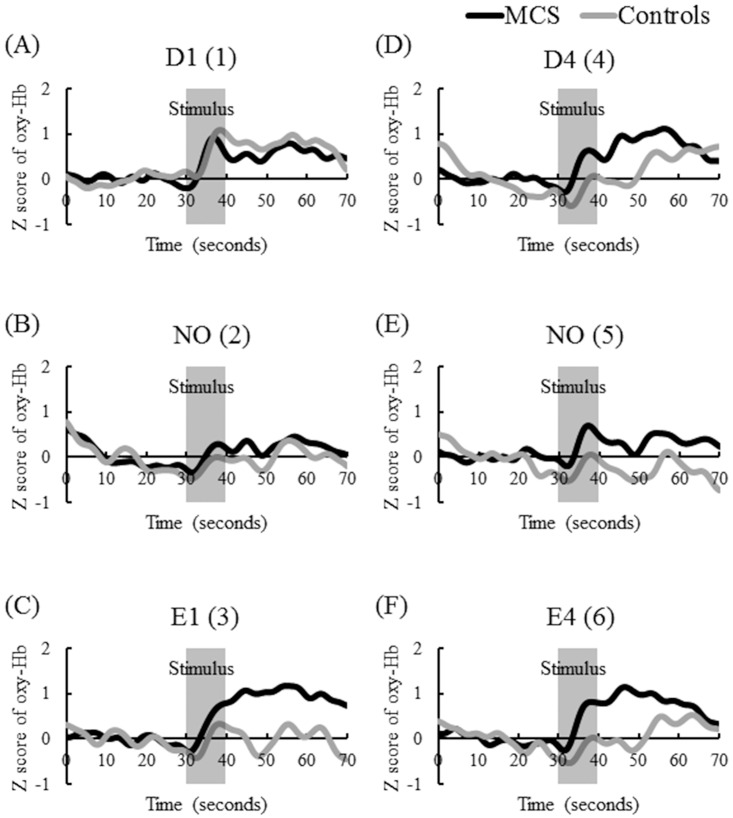
Fig 4. Time-course of average z-scores of all channels for oxygenated hemoglobin (oxyHb) levels in patients with multiple chemical sensitivity (MCS) (n = 10) and controls (n = 6) during pre-rest (baseline, 10–30 s), stimulation (30–40 s), and post-rest (recovery, 40–70 s).
Y- and X-axes present the z-scored oxyHb values and times, respectively. Signals reflecting the oxyHb concentration changes in arbitrary units were calculated (millimolar–millimeter). The signal data were adjusted using a fast Fourier transform filter smoothing technique (OriginPro 2016 software of OriginLab Corporation). The cutoff frequency was determined at 35 points. The MCS group is indicated as a black line, and the control group is indicated as a gray line. Abbreviations: D1, γ-undecalactone, and concentration level 1; D4, γ-undecalactone, and concentration level 4; E1, skatole, and concentration level 1; E4, skatole, and concentration level 4; and NO, non-odorant. Numbers in parentheses in column 1 indicate the order of the six repetitions (1–6).

