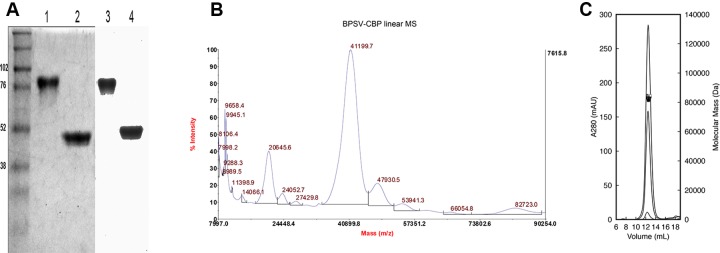
Fig 1. Molecular characterisation of BPSV-CBP.
(A) Coomassie blue staining of SDS-PAGE (left) and Western Blot (right) analysis of the BPSV-CBP shows protein bands of ~80 kDa under non-reducing conditions (lanes 1 and 3) and ~45 kDa under reducing conditions (lanes 2 and 4). (B) MALDI tandem Time-of-Flight mass spectrometry analysis of the BPSV-CBP showing the main monomeric species has 41199.7 and 20645.9 m/z for 1+ and 2+ ions, respectively (MALDI TOF/TOF, Applied Biosystems). (C) Multi-angle laser-light scattering size-exclusion chromatography (MALLS-SEC) analysis of the BPSV-CBP over three concentrations (2, 1, 0.05 mg/ml) shows estimated molecular mass for the dimer protein is 82.4 kDa.

