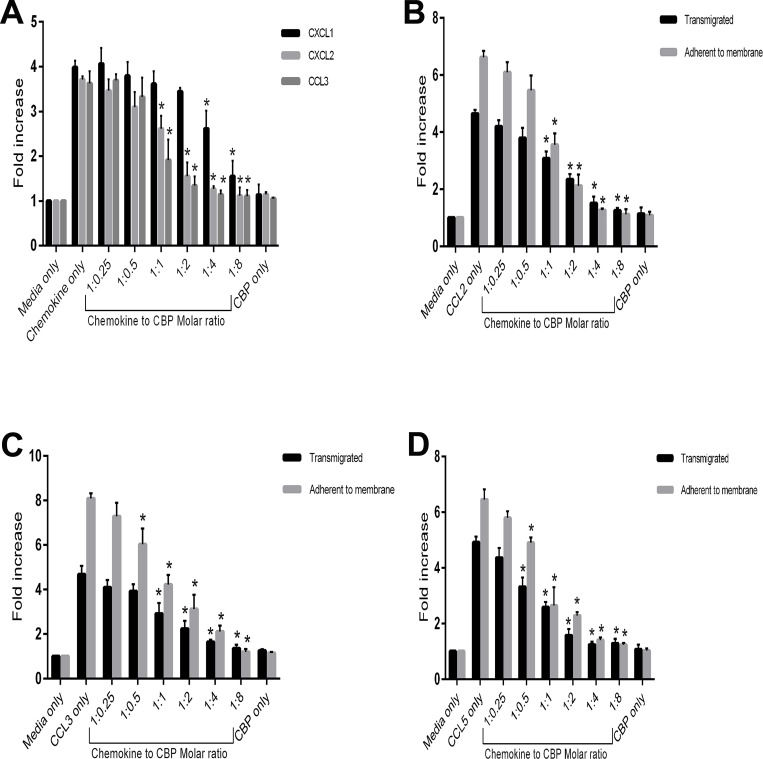
Fig 3. Inhibitory effect of the BPSV-CBP on in vitro migration of neutrophils and monocytes in response to CC and CXC chemokines.
(A) 1 x 10⁵ neutrophils were placed into the upper chamber of the transwell assay system containing CXCL1, CXCL2 (200 ng/ml) or CCL3 (100 ng/ml) plus serial dilutions of the CBP to give the molar ratios shown (chemokine to CBP), and incubated for 2 h. The migrated cells were collected and counted by flow cytometry. The fold increase represents the migration of neutrophils compared with the media-only control. The combined data are shown as mean ± SD of three independent experiments conducted in duplicate and significant differences to chemokine-only are indicated by asterisks (P < 0.05, Tukey’s test analysis of variance, (ANOVA) GraphPad Prism). (B-D) 5 x 10⁵ monocytes were placed into the upper chamber of the transwell assay system containing CCL2 (50 ng/ml) (B), CCL3 (50 ng/ml) (C) or CCL5 (25 ng/ml) (D) plus serial dilutions of the CBP to give the molar ratios shown (chemokine to CBP), and incubated for 3 h. The transmigrated cells were collected and counted manually (black bars). The cells that adhered to the underside of the membrane were also stained and counted (grey bars). The fold increase represents the migration of monocytes compared with the media-only control. The combined data are shown as mean ± SD of three independent experiments conducted in duplicate and significant differences to chemokine-only are indicated by asterisks (P < 0.05, Tukey’s test ANOVA, GraphPad Prism).

