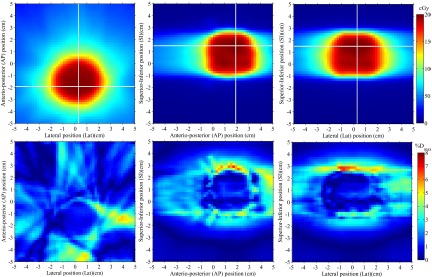
FIG. 6.
3D dose reconstruction of a 360° rotation VMAT brain treatment. Three perpendicular dose planes are shown (top), along with their absolute dose differences with respect to the expected input dose from Pinnacle3 (bottom). Horizontal and vertical white lines on each 2D dose distribution represent the localization of the two other depicted dose planes.

