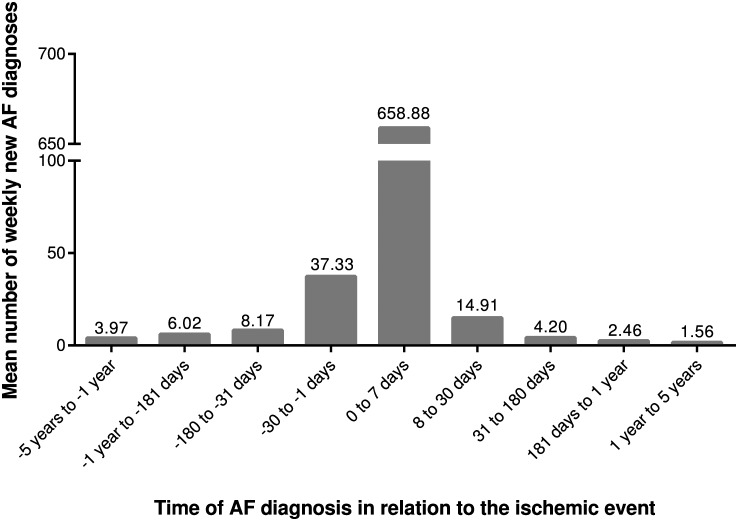
Fig 3. First AF diagnoses according to temporal distance from first ischemic event.
The mean number of first AF diagnoses per one week is presented according to temporal distance from the first ischemic event. Ischemic stroke/TIA has occurred at time point zero. Negative values portray time before the event and positive values time after the event. Timing could not be reliably classified in 740 patients with a long history of AF: N = 2,605.

