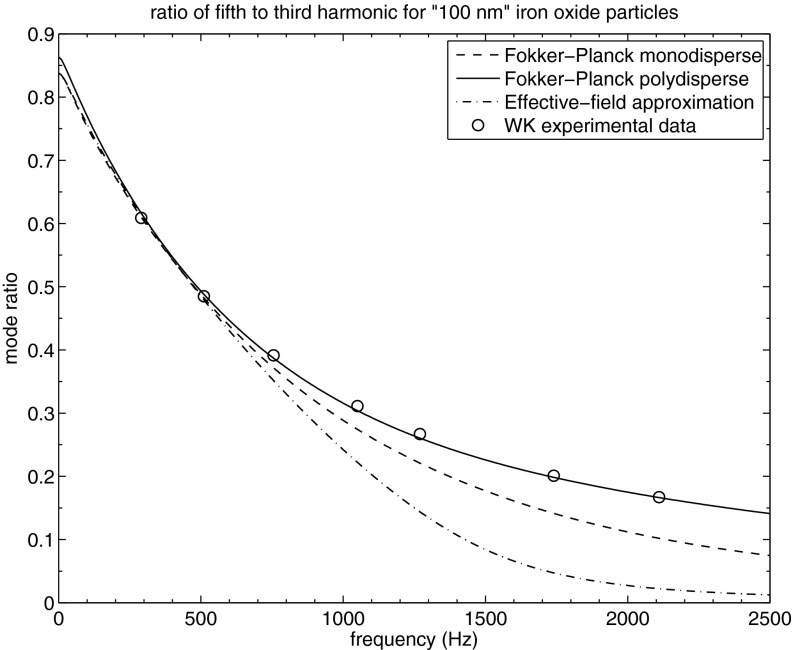
FIG. 1.
Measured and calculated ratios of the fifth to third harmonics as a function of frequency for the water ferrofluid with the “” iron oxide sample. The measured values (indicated with circles) are from Weaver and Kuehlert (Ref. 7). The calculated curves assume , , and for the monodisperse case. For the polydisperse case R refers to the average radius. The dot-dashed line is the ratio from the effective-field approximation, the dashed line is the ratio from the FP monodisperse model, and the solid line is the ratio from the FP polydisperse model. The magnetic dipole moments and other parameters in the fits are described in the text. Excellent agreement is obtained for the polydisperse model.

