Abstract
Purpose:
M5L, a fully automated computer-aided detection (CAD) system for the detection and segmentation of lung nodules in thoracic computed tomography (CT), is presented and validated on several image datasets.
Methods:
M5L is the combination of two independent subsystems, based on the Channeler Ant Model as a segmentation tool [lung channeler ant model (lungCAM)] and on the voxel-based neural approach. The lungCAM was upgraded with a scan equalization module and a new procedure to recover the nodules connected to other lung structures; its classification module, which makes use of a feed-forward neural network, is based of a small number of features (13), so as to minimize the risk of lacking generalization, which could be possible given the large difference between the size of the training and testing datasets, which contain 94 and 1019 CTs, respectively. The lungCAM (standalone) and M5L (combined) performance was extensively tested on 1043 CT scans from three independent datasets, including a detailed analysis of the full Lung Image Database Consortium/Image Database Resource Initiative database, which is not yet found in literature.
Results:
The lungCAM and M5L performance is consistent across the databases, with a sensitivity of about 70% and 80%, respectively, at eight false positive findings per scan, despite the variable annotation criteria and acquisition and reconstruction conditions. A reduced sensitivity is found for subtle nodules and ground glass opacities (GGO) structures. A comparison with other CAD systems is also presented.
Conclusions:
The M5L performance on a large and heterogeneous dataset is stable and satisfactory, although the development of a dedicated module for GGOs detection could further improve it, as well as an iterative optimization of the training procedure. The main aim of the present study was accomplished: M5L results do not deteriorate when increasing the dataset size, making it a candidate for supporting radiologists on large scale screenings and clinical programs.
Keywords: lung CT, computer aided detection (CAD), image processing, 3-D segmentation, LIDC IDRI, ANODE09, screening
1. INTRODUCTION
Lung cancer accounts for about 19% and 28% of cancer-related deaths in Europe1 and the United States of America,2 respectively. An improved prognosis would likely save thousands of lives every year, with a very relevant impact on global health statistics. As it happened for other types of cancer (e.g., breast cancer), an early diagnosis is expected to help in optimizing the effectiveness of treatment, improving its outcome and reducing the mortality.
Since lung cancer is most frequently detectable as noncalcified pulmonary nodules, computed tomography (CT) is the most appropriate imaging modality for its early detection.3 The concept of screening, already adopted for breast cancer, is being considered for lung cancer as well: several pilot programs based on low-dose high-resolution CT were operated worldwide4–6 during the last decade. Recent results reported by the National Lung Screening Trial (NLST)7 show a statistically significant reduction (about 20%) of the 5-yr mortality in the branch subject to CT screening as compared to chest x-ray. The design and operation of large scale lung cancer screening programs are now being considered, with the goal of maximizing their effectiveness and minimizing their cost.
Among the relevant issues to be addressed are as follows.
-
•
The optimization of the nodule detection performance, in terms of sensitivity and specificity, which could be based on double-reading. It was indeed observed that a relevant fraction of lung nodules (20%–35%) are missed in single-reader screening diagnoses.8 Moreover, the radiologist performance is strongly dependent on experience and physical conditions such as stress and fatigue, which cause fluctuations in the inter- and intraradiologist sensitivity, respectively.
-
•
The size of imaging data that must be coherently handled, since multidetector helical CT with thin collimation generates up to 600 2D images per scan.
-
•
The amount of human resources (i.e., the number of radiologists) involved in the annotation process, since a careful reading of a high-resolution CT requires an average time of several minutes.
In such a scenario, computer-aided detection (CAD) algorithms could support radiologists with an automated identification and segmentation of small nodules, a signature of possible early stage disease. Several studies9–11 reported an improvement in the sensitivity of radiologists when assisted by CAD systems, in addition to a relevant time saving. Other studies12,13 observe that the increase in detection rate is associated to an increase in the number of false-positive findings. However, CAD systems act as detection rates equalizers between observers of different levels of experience.12
In order to be effectively introduced in the report-generating process, CAD systems must provide an adequate performance [high sensitivity and as low as possible rate of false positives (FP)], properly validated on as large as possible a sample of CTs, so as to keep under control the main sources of performance variability and degradation:
-
•
the intercenter variability of acquisition setups, which turns into different properties for the images (one above all: the reconstruction-related equivalent thickness of the 2D slices);
-
•
the different annotation criteria adopted by different screening programs and/or by different sites;
-
•
the definition of a training sample that is representative of the features of the entire population of the structures being searched for.
While the annotation-related variability can—to some extent—be parametrized with a proper algorithm configuration (e.g., selection of findings with a radius larger than a protocol-related minimum value), the slice thickness and the lack of generalization issues are related to two main conditions: the size and heterogeneity of the training, testing and validation samples, and the algorithm design.
With the goal of providing an adequate overall performance averaged over different types of nodules, given the relatively small training sample size, a small number of key features were selected. However, should a CAD system be optimized for a specific category of nodules, like ground glass opacities (GGO), a training sample larger than the presently available one would be required.
The paper aims at validating the M5L CAD, which combines the lung channeler ant model (lungCAM) and voxel based neural approach (VBNA) subsystems and includes segmentation, nodule hunting, and classification, on the largest and most heterogeneous dataset available, so as to evaluate its readiness for application as a support for screening programs and clinical practice.
The upgrade of the lungCAM subsystem with respect to the channeler ant model (CAM) segmentation algorithm is discussed in detail; the VBNA subsystem, on the other hand, was already described.14,15
2. MATERIALS
Among the required features of a system for clinical and screening applications is the capability to provide a performance independent of the dataset source: for that reason, several datasets were analyzed, collected both from screening programs and from clinical practice.
2.A. Lung Image Database Consortium (LIDC)/Image Database Resource Initiative (IDRI)
The LIDC and IDRI provide the largest publicly available collection of annotated CTs:16 1018 CT scans are available since 2011. LIDC/IDRI is a multicenter and multimanufacturer database, with CTs taken at different collimation, voltage, tube current, and reconstructed slice thickness. It provides a sample likely to realistically represent the input from a large scale multicenter screening program as well as clinical practice. In order to capture the inter-reader variability LIDC/IDRI provides, for each CT scan, four annotations made by different expert radiologists, obtained with a two phase reading modality.
2.B. ITALUNG-CT
The ITALUNG-CT study,5 carried on in Italy over the last decade, aimed at verifying the effectiveness of screening in reducing the lung cancer mortality rate. A sample of 20 low-dose high-resolution CTs, acquired in the so-called screening setting (140 kV, 70–80 mA, 1.25 mm reconstructed slice thickness) was made available for the validation. The scans were annotated by two experienced radiologists, who were requested to identify nodules by defining a cue point and a radius and by labeling the finding as relevant (diameter larger than 5 mm, type 1) or not (diameter in the 3–5 mm range, type 2, a possible recent cancer formation to be kept under control in follow-up sessions).
2.C. ANODE09
The ANODE09 (Ref. 17) data set consists of 55 anonymized CT scans provided by the Utrecht University Medical Center and originates from the NELSON study, the largest lung cancer screening trial in Europe. Five CT scans are made available together with the radiologist annotations and can be used for training a CAD system; fifty scans can only be used for a blind validation. Most of the database was randomly selected; however, some CTs with a large number of nodules were deliberately included. The ANODE09 annotation protocol foresees the labeling of relevant nodules when their diameter is larger than 4 mm.
2.D. Training dataset
The M5L CAD neural-network classifiers, for lungCAM and VBNA, were trained on 69 lung CT scans from LIDC/IDRI, 5 from ANODE09 and 20 from ITALUNG-CT, as discussed in Ref. 18. The 69 LIDC/IDRI CTs had already been used for training M5L to submit the results to the ANODE09 challenge. For the full LIDC/IDRI dataset analysis, we decided to keep the same training dataset so as to make the results directly comparable across the three databases. Since one of the main purposes of this validation is to show that even without changing parameters the system performance is satisfactory, the algorithm parameters were not changed and were the same for all three datasets for the present analysis.
The results were obtained on 949 CT scans from the LIDC/IDRI database (excluding the 69 CT scans randomly selected from the training subset) 50 scans from ANODE09 and 20 from ITALUNG-CT.
For further reference, the shared lists corresponding to each LIDC/IDRI subset have been saved in The Cancer Imaging Archive online database by the National Cancer Institute and are available for download at http://cancerimagingarchive.net with the following names:
-
•
LIDC_training_lungCAM: 69 cases for training;
-
•
LIDC_test_lungCAM: 949 cases for the validation.
3. THE lungCAM ALGORITHM
The lungCAM was developed by the MAGIC-5 Project19 as part of a multithread CAD system for radiologist support in the lung cancer diagnosis, that also includes algorithms based on Region Growing (RGVP)20 (not supported anymore) and voxel-based neural analysis (VBNA).14,15
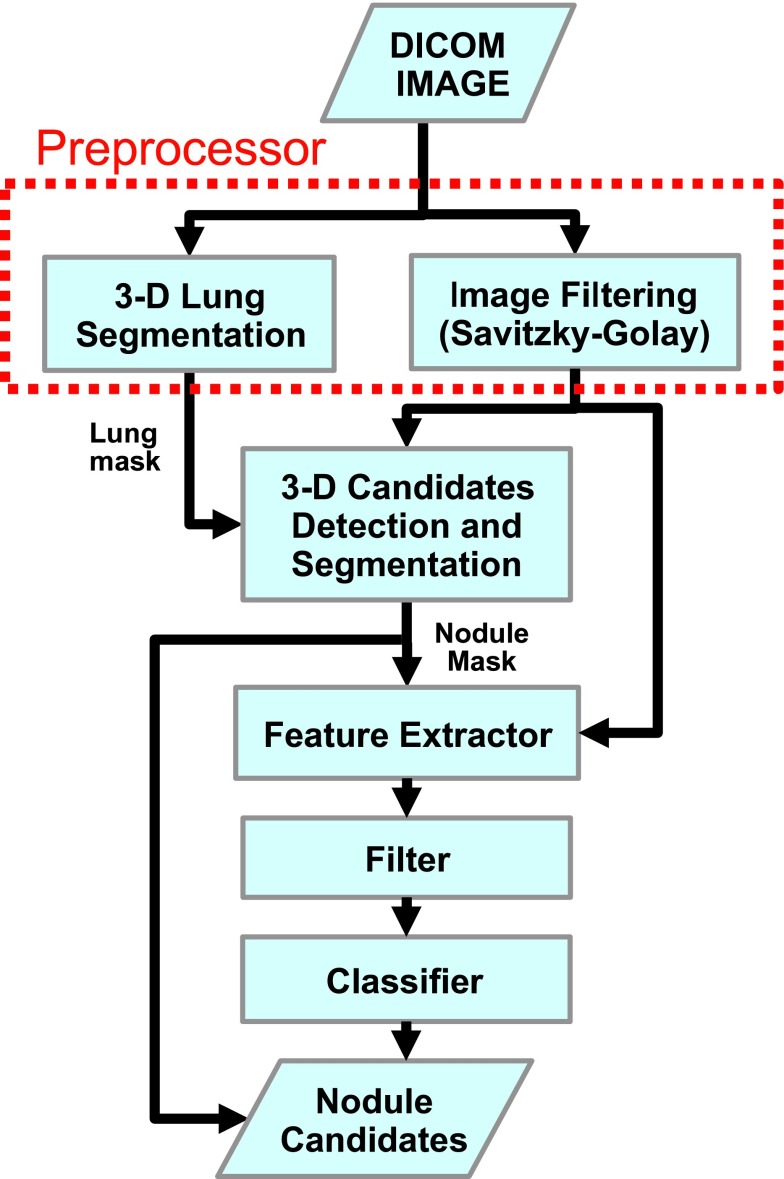
At the highest abstraction level, the lungCAM structure is a standard approach, as shown by the algorithm block diagram (Fig. 1): the preprocessing stage (equalization and lung volume segmentation) is followed by a search for Regions Of Interest (ROIs), an analytical filter, and a neural classifier.
FIG. 1.
lungCAM block diagram.
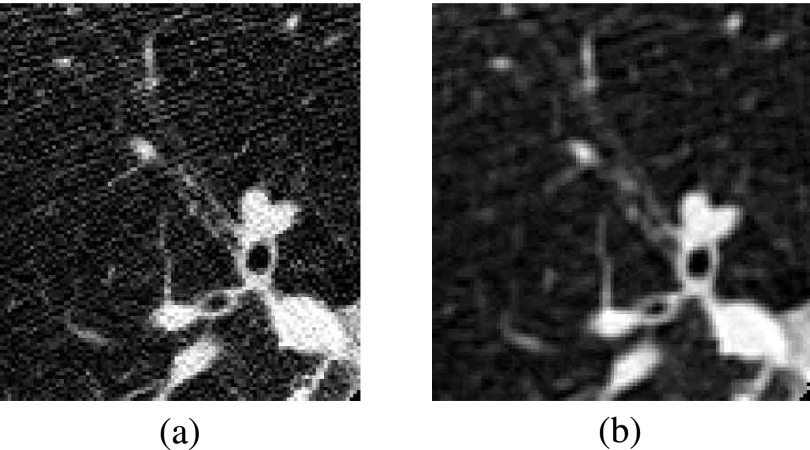
Before starting the actual analysis, CT scans in DICOM standard format are preprocessed to reduce the noise contribution: each 2D slice is analyzed with a Savitzky–Golay filter21,22 that provides noise reduction without loss of resolution. Figure 2 shows an example of a 2D slice before and after the filtering stage.
FIG. 2.
(a) Original slice image, (b) slice image after 2-D Savitsky–Golay filter.
From then on, every step of the lungCAM algorithm, including the features evaluation, is intrinsically 3D.
3.A. Lung segmentation
The lung segmentation, described in detail elsewhere,23 proceeds according to four main steps:
-
1.
analysis of the CT Hounsfield unit (HU) level distribution and evaluation of the intensity threshold to be applied in the following stages;
-
2.
3D region growing of the lung volume with the detected threshold;
-
3.
wavefront algorithm for the definition of the lung surface on the inner side and the removal of the trachea and the main bronchi;
-
4.
morphological closing with a cylinder from the outside in order to include pleural nodules and close the holes left by vessels.
A check on the training/testing and validation data-sets confirmed that none of the radiological findings were rejected at this stage.
3.B. Nodule segmentation
The segmentation algorithm is performed with the CAM,24 based on virtual ant colonies and conceived for the segmentation of complex structures with different shapes and intensity range in a noisy 3D environment. The CAM exploits the natural capabilities of virtual ant colonies to modify the environment and communicate with each other by pheromone deposition. The ant life cycle is a sequence of atomic time steps, during which the behavior is determined by a set of rules that control the pheromone release, the movements and the variations of the ant energy, a parameter related to breeding and death.
The lung internal structures are segmented by iteratively deploying ant colonies in voxels with intensity above a predefined threshold (anthills). Ants live according to the model rules until the colony extinction: the pheromone deposition generates pheromone maps.
Each voxel visited by an ant during the life of a colony is removed from the allowed volume for future ant colonies. New ant colonies are iteratively deployed in unvisited voxels that meet the anthill requirement. By an iterative thresholding of pheromone maps, a list of ROI candidates is obtained. ROIs with a radius larger than 10 mm are postprocessed in order to disentangle nodules attached to internal lung structures like vessels and bronchi.
In order to speed up the ant deployment, the probability Pij for a voxel to become the actual ant destination was changed from
| (1) |
to
| (2) |
where W(σj) depends on the amount of pheromone in voxel vj and in is the same as Pij(vi → vj) but substituting W(σj) by the intensity of the voxel Ij. The resulting probabilities are normalized to a unitary total probability.
The new rule favors destination voxels with low integrated pheromone deposition and high HU values, i.e., voxels with few visits: therefore, the colony expands faster in the 3D environment and the algorithm speed increases.
A limit to the maximum number of voxel visits Nv(Ij) that a voxel j with HU intensity Ij receives from ants was also set to
| (3) |
where Imax is the maximum HU intensity value in the lung volume and Nmin is a free parameter related to the algorithm speed, set to 5 for the present application.
Another limitation was related to the fact that for small low-intensity nodules, the ant colony would extinguish too quickly to produce a pheromone image that could be identified by the threshold-based pheromone map analysis. The ant capability to explore low intensity voxels depends on the energy variation rate Eq. (4), i.e., on how many steps in low intensity voxels ants can take on average before their energy drops to the death level. When objects are very small, also the initial random movement can play an important role in causing the premature colony extinction
| (4) |
The issue was addressed with a change in the ant colony evolution dynamics: the ant energy parameters (the initial energy ε0 and its variation rate α) are initially set to values that cause a quick ant reproduction rate. Only when the colony population grows above 100 units, the parameter values switch to the model default values, so as to avoid the exponential increase of the colony population: in such a way, a better pheromone image for small and low-intensity nodules is obtained without affecting the segmentation of large structures.
3.B.1. Structure segmentation
The CAM is iteratively deployed in the right and left lungs, separately, as a segmentation method for the vessel tree and the nodule candidates. The first ant colony segments the vessel tree, starting from an anthill in the vicinity of its root. The segmented object is then removed from the original image and the coordinates of all its voxels are stored as a single ROI.
In the remaining image, iteratively, any voxel with intensity above a predefined threshold (−700 HU) is a new anthill and a colony deployed from there generates a pheromone image. When no more voxels meet the condition to become an anthill, the information provided by the global pheromone map is analyzed.
3.B.2. Nodule hunting
The pheromone map analysis is also iterative: each voxel with a pheromone content above a minimum accepted value is used as a seed for a region growing with an adaptive threshold which is iteratively lowered until a minimum growth rate of the region is reached.
Every grown region with a radius in the 0.8–25 mm range is considered as a nodule candidate.
3.B.3. Juxta-vascular nodules
About 20% of relevant pulmonary nodules are segmented together with a vascular structure they are connected to. If features were evaluated for the whole ROI, these nodules would typically be rejected by further filtering and classification.
In order to address the problem, a dedicated algorithm module was developed. All the structures obtained from the pheromone map analysis with radius larger than 10 mm are further analyzed in order to identify and disentangle spherical-like substructures. The 10 mm value was empirically set based on the minimum size for attached structures that causes a relevant change in the ROI feature values.
Each voxel that belongs to the structure being analyzed is averaged with the neighbors inside a sphere of radius R. Then, the average map is thresholded at the Tph pheromone value again, resulting in a thinner object. Structures with a diameter smaller than R disappear (e.g., thin vessels attached to the nodules). However, also the nodules shrink. In order to recover the nodule original size, the neighbors of each remaining voxel in the average inside a sphere of radius R/2 with value above Tph + Tph/3 in the original map are restored as part of the structure.
The procedure is repeated three times, with spheres of increasing radius (R = 1.5, 2.5, 3.5 mm) that generate substructures of increasing size. The output voxels of the three iterations are combined in logical OR to generate a final nodule candidate output mask, which is then treated as a ROI for further analysis.
Figure 3 shows an example of separation of a juxta-vascular nodule from the vascular tree.
FIG. 3.
Steps of separation procedure for juxta-vascular nodules. (a) Original image. (b) Pheromone segmentation. (c) Pass 1 with R = 1.5 mm. (d) Pass 2 with R = 2.5 mm. LIDC/IDRI case LIDC-IDRI-0039, nodule at 207, 206, 175.
3.C. ROI features
The choice of a suitable set of ROI features is a key to the success of the filtering and classification stages. Ideally, any computable quantity which is expected to show a different pattern for true nodules and false candidates would be a useful feature. However, the use of a large number of features on a small training dataset could bias the classifier and cause a loss of generality.
The choice to select a small number of features for the neural classifier training aims at optimizing the generality and keeping the performance stable as the validation dataset size increases.
A set of 13 features was selected for the nodule candidate analysis, according to the following criteria:
-
•
3D spatial features which are invariant to rotation and translation and can disentangle spherical-like structures from ROIs originating from vessel parts or lung walls;
-
•
features based on the voxel HU intensity, so as to capture density patterns;
-
•
the fraction of ROI voxels attached to the walls of the lung volume is crucial in distinguishing internal and juxta-pleural nodules, which are characterized by a different shape; therefore, its use allows the classification of both the subsamples with the same neural network.
The radius R is defined as the average distance of ROI voxels from the center of gravity times 4/3, so as to be equal to the radius of the sphere if the ROI was perfectly spherical.
The center of gravity coordinates Xi are computed using the HU values as weights, with an extra weight-factor of 0.1 for the voxels on the ROI surface
| (5) |
where the k index runs over all the voxels in the ROI, Ik is the intensity associated with the voxel k in HU units, i is equal to 1, 2, and 3 for x, y, and z, respectively, and rk,i is the position vector of voxel k. The extra weight factor εk helps to better locate the center of gravity in case of ROIs that include some pieces of vessel or pleura surface, by suppressing the contributions of nodule substructures with a high surface to volume ratio.
The Sphericity is defined as the ratio of the ROI volume to the volume of a sphere with radius R equal to that of the ROI.
The Fraction of voxel connected to the lung volume surface is calculated by dividing the number of voxels connected to the lung mask by the number of surface voxels of the segmented object.
The features labeled with outside mask in Table I are computed by enlarging the original segmentation using a spheroidal structuring element of 1.5 mm of radius.
TABLE I.
List of features extracted from the nodule output mask. Features labeled with the asterisk were not used in the classification stage.
| Geometrical features | Intensity-related features |
|---|---|
| Center of gravity Xi=x,y,z (*) | Average |
| Radius (mm) | Average outside mask |
| Sphericity | Standard deviation |
| Skewness of distance from Xi | Standard deviation outside mask |
| Kurtosis of distance from Xi | Maximum |
| Volume (mm3) (*) | Entropy |
| Fraction of voxel connected to lung cage | Entropy outside mask |
In the present work, a further optimization of the set of features was not carried on, although the size of the training and validation dataset would allow it: our goal is to demonstrate that, even with a training based on a fairly small number of lung nodules, a CAD system can be predictive and keep its performance on large validation datasets such as LIDC/IDRI.
3.D. Filtering
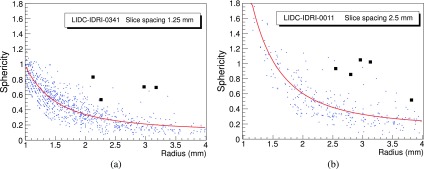
The average number of ROIs after the nodule hunting, depending on the number of slices, ranges between several hundreds to few thousands per CT scan, a number far too large to be used as an input for a neural-network classifier. The vast majority of findings is easily rejected with an analytical filter based on correlations between the radius, the sphericity, and the fraction of voxels connected to the lung mask. Figure 4 shows the correlation between the Sphericity and the Radius of nodule candidates, with the true nodules highlighted as black squares: it is clear that the correlation can be used to filter most of the FP findings.
FIG. 4.
Distribution of Sphericity as a function of Radius for two scans from LIDC/IDRI, with slice spacing of 1.25 mm (a) and 2.5 mm (b). Black square markers are used for the candidates corresponding to true nodules.
However, the discrete nature of the CT images implies that geometrical features depend to some extent on the voxel size, particularly for small ROIs with few voxels. Some CAD systems25 have adopted a downsampling approach, so as to obtain a comparable slice spacing in all the dataset. In LIDC/IDRI, the CT slice spacing ranges from 0.6–3.0 mm: as a consequence, the distribution of values for some features, like the Sphericity, shows different values depending on the slice spacing.
Figures 4(a) and 4(b) show the correlation between Sphericity and Radius values for nodule candidates obtained from CTs with a slice spacing of 1.25 and 2.5 mm, respectively: the correlation depends on the slice spacing and the Sphericity shifts to higher values in the 2.5 mm case. It is therefore not possible to use the same filter function on the whole dataset without compensating for this effect.
The correlation between the ROI Sphericity and Radius was then equalized by fitting it for each single CT with the S = a/Rb + c function, represented by the red line in Fig. 4.
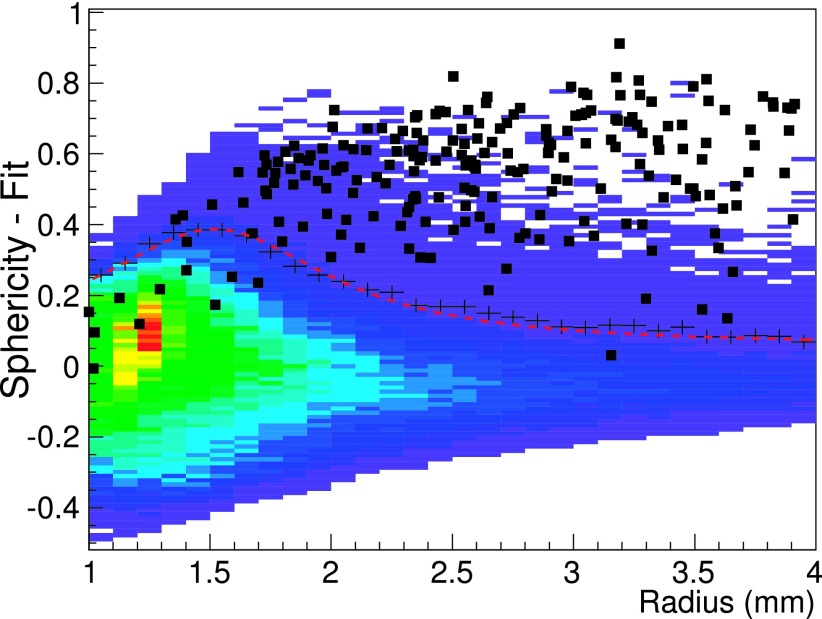
The equalized global distribution is then obtained, for all the CT scans, as the difference between the original Sphericity of a nodule candidate and the threshold Sphericity obtained from the single CT fit (Fig. 5). For each bin along the x axis, the black crosses correspond to the average value plus 2 standard deviations of the sphericity difference and were used as reference points to fit the final filter function, represented by the red dashed line. All the ROIs with sphericity differences smaller than the filter function value were then discarded.
FIG. 5.
Merged plot of the difference between Sphericity and Sphericity-fit as a function of the Radius for all training scans. The black crosses are two standard deviation above the average for each bin and were used as reference to fit the final filter function represented by the red line.
In addition to the sphericity-related selection, two other filtering conditions were applied to the nodule candidates: the Fraction of voxels connected to lung surface is required to be less than 0.6 and the Radius must be larger than 1.2 mm.
Irregular structures are filtered with these criteria. The CT equalization and filtering procedure dramatically reduce the average number of FP findings per scan, from about 1000 to about 50, a value which is appropriate as input for training and running a neural classifier.
The filtering process also reduces the preclassification sensitivity to about 75%–90%, depending on the input dataset.
3.E. The neural classifier
A feed forward neural network (FFNN) was selected as nodule candidate classification method. The training sample was made of 20, 5, and 69 CTs from the ITALUNG-CT, ANODE09, and LIDC/IDRI databases, respectively, for a total of 216 relevant nodules. The training was carried on in cross-validation mode. The FFNN configuration was defined as follows: 13 input neurons, 1 hidden layer with 25 neurons, and 1 neuron in the output layer, representing the probability of the finding to be relevant.
The choice implies that the overall performance is not fully optimized, since it aims at proving the algorithm generality in realistic training conditions (i.e., a training sample much smaller than the validation one). In view of a future application of the lungCAM CAD in screening programs or clinical practice, the optimization can be achieved by iteratively using training samples of increasing size. Furthermore, demonstrating a generalization capability is, at the present development stage, even more important than optimizing the sensitivity on a selected dataset.
4. RESULTS
M5L was validated on the datasets described in Sec. 2. The observed performance is fairly stable, both as a function of the dataset and as a function of the number of scans (for LIDC/IDRI).
Since the improvements described in this paper are related to the lungCAM subsystem upgrade, results for lungCAM alone are discussed in detail, while the M5L performance is presented on the overall dataset.
4.A. Labeling and score
The labeling rule proposed in Ref. 25 was adopted: the gold standard information for the ITALUNG-CT and ANODE09 includes cue points near the center of each nodule and its radius, while for the LIDC/IDRI dataset, the available manual segmentation is used. A candidate is labeled a TP if its segmentation includes a true cue, a FP otherwise.
Since cue points for the LIDC/IDRI nodules are not provided, a different labeling method was adopted: a CAD finding is considered a TP if the centroid of the segmented ROI is contained within (any of) the radiologist segmentation(s).
The Gold Standard reference for the LIDC/IDRI dataset used for training the FFNN was defined as the group of nodules with diameters >3 mm annotated by at least two radiologists. This definition is the closest to the annotation protocols of the ITALUNG-CT and ANODE datasets, both based on double-reading.
Nodules with a diameter >3 mm that were annotated by 1 radiologist and non-nodules were considered as “not-relevant” structures, i.e., neither true nor false findings, and were ignored in the evaluation of the free-response receiver operating characteristic (FROC) curves.
4.B. Nodule detection and segmentation performance
Table II shows the sensitivity of the lungCAM segmentation stage, after filtering, for each database.
TABLE II.
lungCAM nodule detection performance after filtering. Numbers marked with asterisk in the ANODE09 dataset were estimated from the FROC curve.
| Database | Scan | True nodules | TP | FP/CT | Sensitivity (%) |
|---|---|---|---|---|---|
| ITALUNG-CT | 20 | 39 | 32 | 38.6 | 82 |
| ANODE09 test | 5 | 39 | 30 | 16.5 | 76.9 |
| LIDC training | 69 | 138 (at least 2 rad.) | 123 | 38.5 | 89.1 |
| LIDC test | 949 | 1747 (at least 2 rad.) | 1421 | 52.1 | 81.3 |
| TOTAL | 1043 | 1943 | 1606 | 50.7 | 82.6 |
| ANODE09 | 50 | 207 | (∼149)∗ | (∼18.7)∗ | (∼72.4)∗ |
The ANODE09 (50) sample is excluded, since information about true nodules is not publicly available.
The lungCAM performance is quite stable on the different databases, within the statistical error, even though the image parameters, the acquisition and reconstruction conditions, and the annotation protocol are heterogeneous. This feature is particularly important in case of both screening and clinical environment, with imaging studies coming from many sources.
Table III shows the average Jaccard index computed for three different consensus levels by the radiologists, expressed in terms of PMAP levels. A PMAP level, associated to each voxel belonging to a nodule, is defined as the ratio between the number of radiologists that included the voxel in the nodule and the total number of radiologists that performed the annotation.
TABLE III.
Average Jaccard index between the lungCAM nodule candidates and the manual segmentations.
| Consensus/probability map (PMAP) level | Average Jaccard index |
|---|---|
| At least 2/>50% | 0.50 ± 0.20 |
| At least 3/>75% | 0.57 ± 0.19 |
| 4/=100% | 0.60 ± 0.18 |
Messay et al.25 declare an average value of about 63% for 68 nodules reported by three radiologists at PMAP > 50%.
The nodule hunting sensitivity as a function of the nodule size is quite stable between 80% and 90%, with the exception of small and large nodules for which it drops to about 70%. The actual nodule size for LIDC/IDRI is obtained by taking the largest Radius, obtained from the radiologist contour/segmentation of each nodule.
4.C. lungCAM performance
The performance is evaluated in terms of FROC curves. The LIDC test and the ANODE09 databases, not used at all in the training or optimization processes, provide a large and heterogeneous validation dataset.
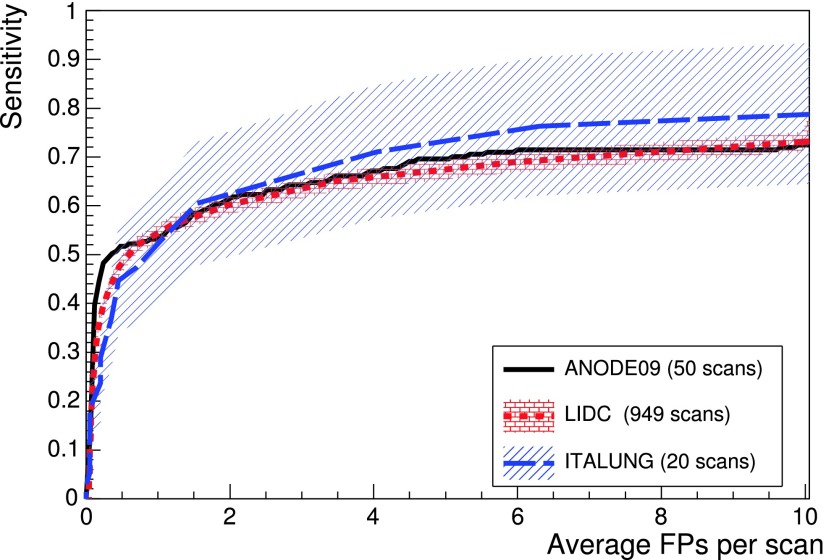
The trained FFNN was applied to 949 LIDC/IDRI and 50 ANODE09 scans and the lungCAM performance (Fig. 6) is very similar despite the differences between the datasets.
FIG. 6.
lungCAM FROC curves for the LIDC test and the ANODE09 validation datasets. The ITALUNG-CT FROC, obtained excluding its 20 scans from the training dataset, is also included for reference. The error bands show the statistical error on the LIDC/IDRI and ITALUNG-CT sensitivity.
Since the LIDC/IDRI is a very heterogeneous database and only 69 out of 1018 were used scans for training (and similarly 5 out of 55 for ANODE09), the results indicate a satisfactory generalization capability of the lungCAM system. The ITALUNG-CT FROC, obtained with a training set that only included nodules from the 69 LIDC training and the 5 ANODE09 CT scans, is also compatible.
A full statistical comparison across the three datasets is difficult, mostly because of the different requirements in the annotation protocol: LIDC/IDRI, ANODE09, and ITALUNG-CT foresee a nodule cutoff at a diameter of 3, 4, and 5 mm, respectively, introducing a systematic difference which cannot be neglected and is hard to evaluate with the available information. When possible, the statistical uncertainty was evaluated in terms of confidence interval: both in the relevant working range (6 < FP/scan < 8) and in the sensitivity rising edge (FP/scan < 2), the statistical uncertainty on FP/scan for ANODE09 and ITALUNG-CT dominates, given the relatively low number of true findings, so the results are fully compatible with LIDC/IDRI.
The error bands, showing the statistical uncertainty for LIDC/IDRI and ITALUNG-CT, confirm the compatibility of the results, although at least two large-size datasets would be required for a more stringent verification. The ANODE09 error band cannot be evaluated as the number of true findings is unknown.
4.C.1. LIDC/IDRI
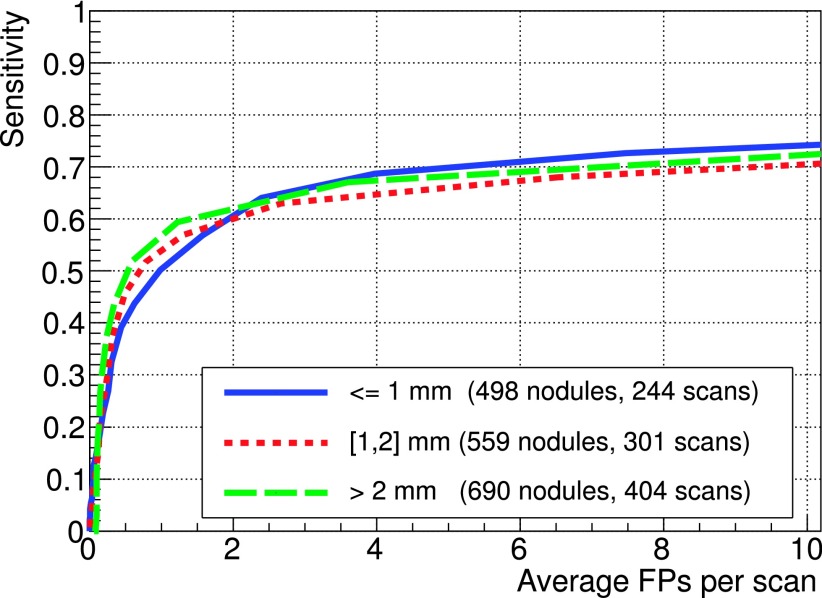
In order to validate the approach based on the equalization of dimensional parameters (expressed in mm) via the fitting procedure on FP findings before the filtering stage, the FROC curves for three ranges of slice spacing were computed separately and compared (Fig. 7): the results show a compatibility within 5% over the full FP range, with a slightly better sensitivity for larger (smaller) slice spacing below (above) 2 FP/scan.
FIG. 7.
FROC curves on LIDC test subsets corresponding to different scan slice spacing ranges (SR < 1 mm, 1 mm < SR < 2 mm, SR > 2 mm). The number of TP nodules and the number of scans for the different subsamples are statistically comparable.
The LIDC/IDRI database provides the detailed nodule segmentation for nodules with a diameter >3 mm, as well as information on several features: radiologists ranked subjective characteristics of the nodules such as subtlety, internal structure, spiculation, lobulation, shape sphericity, solidity, margin, and likelihood of malignancy.
The availability of this classification allows the analysis of results as a function of the nodule type, helping in understanding the strengths and weaknesses of the lungCAM algorithm.
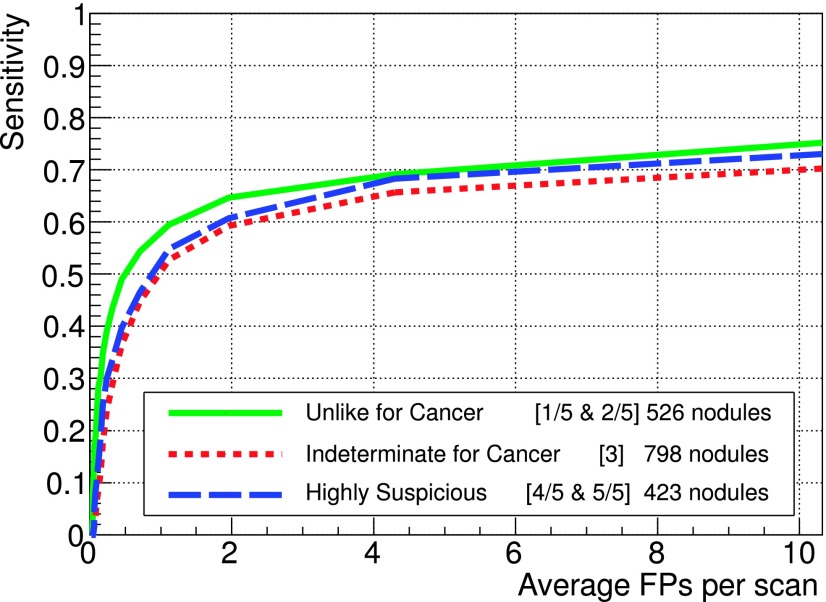
Figure 8 shows the FROC curves for three groups out of five available malignancy rating: unlike cancer (values of 1 and 2), intermediate (3), and highly suspicious (4 and 5), represented by 526, 798, and 423 nodules, respectively. No information about malignancy in the training part was provided to the FFNN, so the classifier is expected to perform comparably for each type of lesion. The better performance at low FP values for unlike cancer nodules is probably related to the fact that they are typically calcified and therefore easier to detect.
FIG. 8.
FROC curves for different malignancy ratings on the LIDC test dataset. Malignancy scores were grouped as follows: unlike cancer (1 and 2), intermediate (3), and highly suspicious (4 and 5), corresponding to 526, 798, and 423 nodules, respectively.
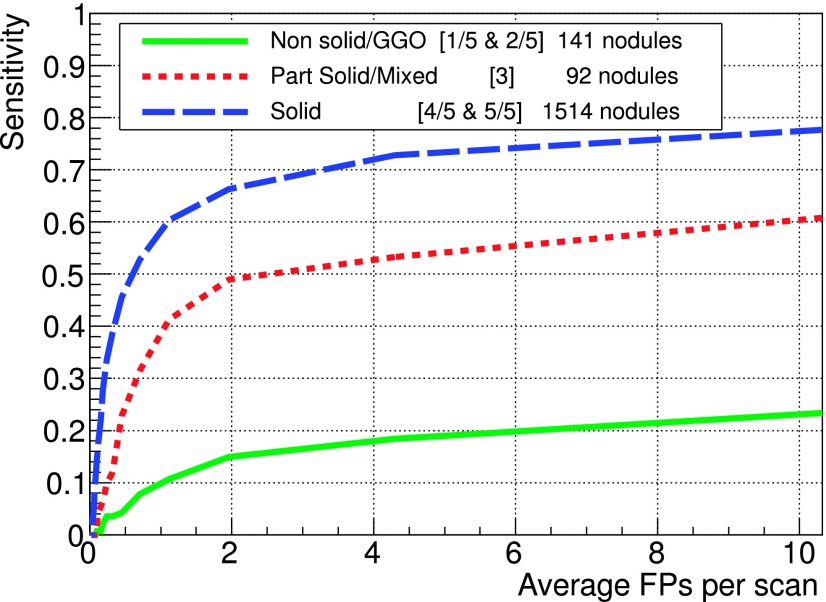
Texture features are not directly included as input to the classifier; however, spherical-like objects are expected to be detected better than others. The analysis of nonsolid lesions or GGO, which represent about 12% of the sample, shows they are poorly segmented and normally rejected during the filtering stage.
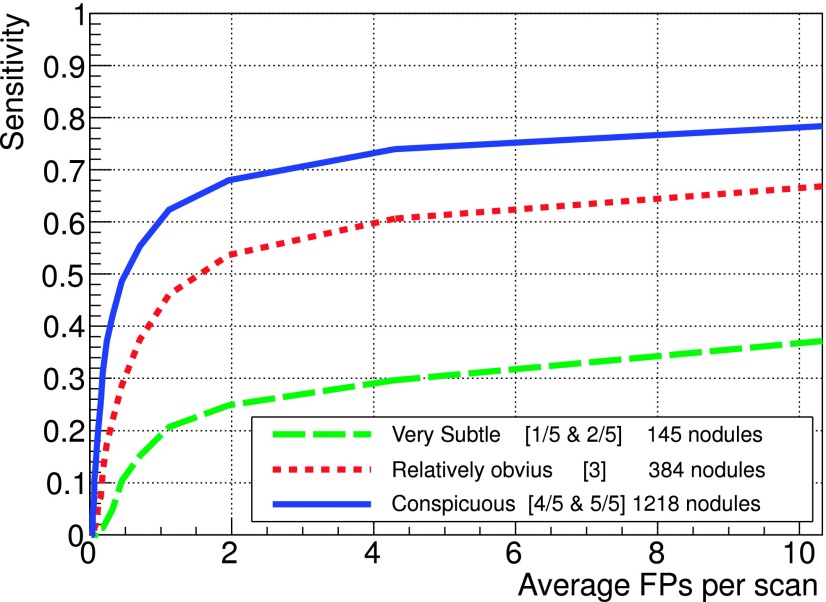
Another interesting characteristic that could affect the system performance is the subtlety score. Subtle nodules are hard to detect by both CADs and radiologists, since in general, their HU intensity is very similar to the surrounding background and they are likely to be missed.
Subtle nodules represent about 7% of the LIDC test dataset and only about 20% of them are detected at 8 FP/scan. In general, CADs need a fine tuning to improve the detection of subtle nodules without increasing significantly the FP rate. However, since also the radiologist sensitivity is likely to be smaller for subtle nodules, before starting any optimization the CAD FP findings should be carefully analyzed by radiologists, so as to identify possible subtle TP findings overlooked in the first round of annotation.
4.C.2. ANODE09
The purpose of the ANODE09 challenge17 was to provide a database of CT scans from a lung cancer screening trial that would allow a fair blind evaluation of CAD algorithms under the same conditions and with the same metric. The only factor causing differences in results would then be the intrinsic CAD system performance, not the data or the details of the evaluation procedure.
ANODE09 results were scored with a metric that emphasizes the performance at low FP values: the overall score of a system is calculated as the average of sensitivity values sampled at specificities 1/8, 1/4, 1/2, 1, 2, 4, and 8 FPs per scan.
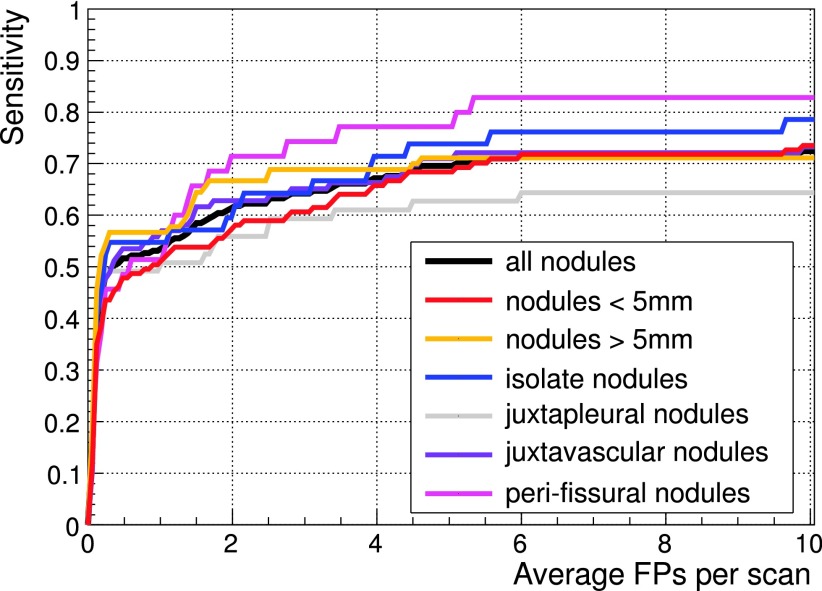
The lungCAM sensitivity at these FP/scan values for all the relevant nodules and for subsets related to different nodule features is summarized in Table IV, while the FROC curves for each type of nodule are shown in Figs. 9, 10, and 11. The early development version of the CAM algorithm, that joined the ANODE09 challenge in 2009 scored 0.254; the lungCAM as described in this work now scores 0.564, with a remarkable improvement.
TABLE IV.
ANODE09 scoring: lungCAM sensitivity at the seven sampling points on the FROC curve and average score value.
| FPs/case | 1/8 | 1/4 | 1/2 | 1 | 2 | 4 | 8 | Average |
|---|---|---|---|---|---|---|---|---|
| Small nodules | 0.359 | 0.436 | 0.478 | 0.513 | 0.572 | 0.658 | 0.718 | 0.533 |
| Large nodules | 0.478 | 0.555 | 0.566 | 0.566 | 0.666 | 0.689 | 0.711 | 0.605 |
| Isolated nodules | 0.428 | 0.524 | 0.547 | 0.547 | 0.595 | 0.714 | 0.762 | 0.588 |
| Vascular nodules | 0.430 | 0.488 | 0.535 | 0.570 | 0.628 | 0.663 | 0.721 | 0.576 |
| Pleural nodules | 0.440 | 0.491 | 0.491 | 0.508 | 0.559 | 0.610 | 0.644 | 0.535 |
| Peri-fissural nodules | 0.314 | 0.457 | 0.485 | 0.514 | 0.714 | 0.771 | 0.828 | 0.584 |
| All nodules | 0.410 | 0.488 | 0.517 | 0.536 | 0.613 | 0.671 | 0.715 | 0.564 |
FIG. 9.
FROC curves for different texture ratings on the LIDC test dataset. Texture score were grouped as follows: nonsolid/GGO (1 and 2), part solid/mixed (3), and solid (4 and 5), corresponding to 141, 92, and 1512 nodules, respectively.
FIG. 10.
FROC curves for different subtlety ratings on the LIDC test dataset.
FIG. 11.
FROC curves on the 50 CTs ANODE09 validation dataset for the different nodule types.
4.D. Combining CADs
From the results of each system presented in Sec. 4, it is clear that lungCAM could be improved in the future, as any other CAD system, focusing on specific weaknesses. However, one quick and effective way to improve is to combine the results of different algorithms, as demonstrated in Ref. 17 for the ANODE09 challenge participants.
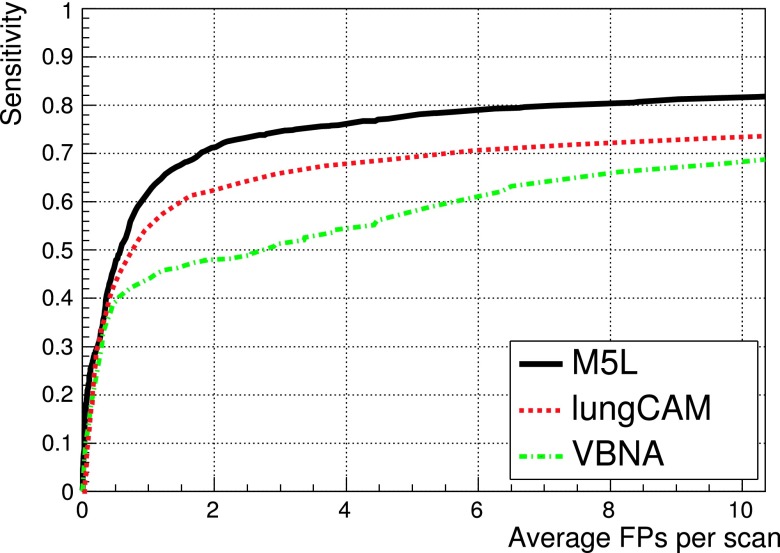
Figure 12 shows the results obtained when combining the lungCAM and VBNA M5L subsystems on the 949 scans of the LIDC test dataset (949 scans).
FIG. 12.
FROC curves of the lungCAM and VBNA M5L subsystems and their combination on the LIDC test validation dataset (949 scans).
The M5L sensitivity at 8 FP/scan reaches 80% which, given the size and heterogeneity of the dataset, is quite remarkable.
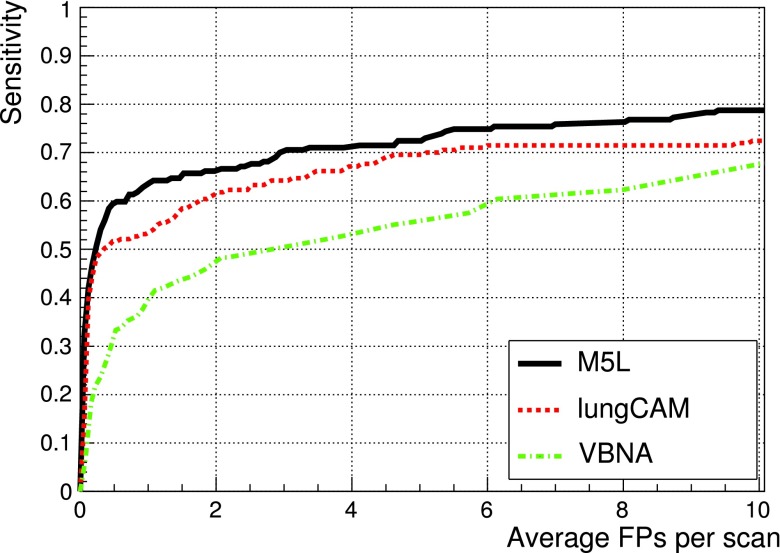
In the case of ANODE09, the combined performance on the validation set, whose FROC is shown in Fig. 13, reaches a sensitivity score of 0.619. If the RGVP subsystem is added, M5L slightly outperforms IsiCAD with a score of 0.64. Further combinations provide even better results: M5L and IsiCAD score 0.752, which further improves to 0.760 when adding FlyesScan.
FIG. 13.
FROC curves of the lungCAM and VBNA M5L subsystems and their combination on the ANODE09 validation dataset (50 scans).
5. DISCUSSION
CAD systems developed by academic research groups were reviewed in various papers:26,27 it is extremely difficult to make a fair comparison between all these CAD systems, mainly because of the difference in the definition of the properties of training, testing and validation datasets, the use of private datasets, insufficient statistics, and sometimes different performance evaluation metrics. Some of them28–31 have analyzed LIDC/IDRI subsets, but none was tested on the full dataset.
Recently, two papers based on large validation datasets were published. One of them discusses the performance of a CAD system in the NELSON (Ref. 4) screening trial.32 A direct full comparison with the results presented in this work is not possible, as we do not have access to the full NELSON dataset; however, the results will be compared to a subsample of data from the NELSON screening program, made available through the ANODE09 study.17 The other paper25 presents results on ANODE09 and on the LIDC/IDRI (Ref. 16) database, the largest available public database. This represent the opportunity to compare performance in almost the same conditions.
Commercially developed systems are usually bound to a specific hardware, so they are tuned for specific acquisition and reconstruction conditions. Besides, available algorithms are certified for reporting nodules above 4 mm in diameter33,34 and usually have a fixed threshold, so the comparison on the same dataset is not possible.
In the following discussion, only published data are considered for a comparison with our results.
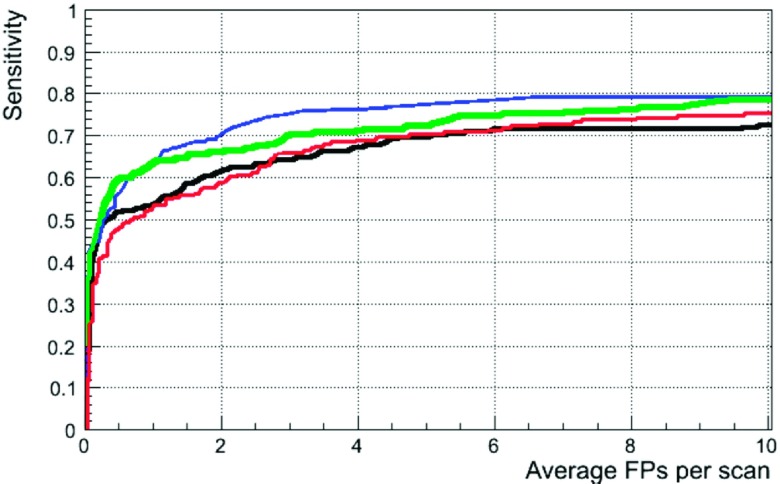
The easiest comparison of lungCAM and M5L is with other participants in the ANODE09 study. The FROC curves for IsiCAD,32 FlyerScan,25 lungCAM, and M5L on the 50 ANODE09 validation scans are presented in Fig. 14. The overall sensitivity score for the four systems is 0.632 (IsiCAD), 0.552 (FlyerScan), 0.564 (lungCAM), and 0.619 (M5L). Values of sensitivity scores and FROCs curves on ANODE09 were provided by the ANODE09 challenge organizers,35 as they are not publicly available on the ANODE09 website yet.
FIG. 14.
FROC curves for IsiCAD (blue), FlyerScan (red), lungCAM (black), and M5L (green) on the 50 ANODE09 validation scans.
IsiCAD (Ref. 32) was developed at the University Medical Center Utrecht, the Netherlands, by the group who organized the ANODE09 study. It is based on shape index and curvedness features and detects nodule candidates with a preclassification sensitivity of about 97% at about 700 FP/scan. The false-positive reduction consists of two consecutive classification steps using k-nearest-neighbor (kNN) classifiers and the feature selection was carried out by “Sequential Forward Floating Selection.” IsiCAD has the best performance, but it has the advantage of having been trained over 722 scans from the NELSON screening program, i.e., the same data source of the ANODE09 validation dataset.
FlyerScan25 was trained on 90 cases provided by the University of Texas Medical Branch. It implements a simple and powerful combination of thresholding and opening operations to segment the nodules candidates, which are detected at a 92.3% preclassification sensitivity at about 500 FP/scan (value provided for nodules >3 mm annotated by at least one radiologist on 84 LIDC/IDRI cases available in 2008). The algorithm was carefully optimized to select the best features and the results of two classifiers using a different numbers of features were compared. With the best classifier and using 40 features on the LIDC/IDRI 84 cases, FlyerScan provides a sensitivity of 80.4% at 3 FP per scan. The same conditions were used to analyze the ANODE09 validation dataset, with the results shown in Fig. 14.
The overall performance of the lungCAM system on the ANODE09 and ITALUNG-CT is comparable to other algorithms. The lungCAM is more selective in the filtering stage, with an average postfilter sensitivity of about 80%, to be compared with about 90% reached by other methods. However, the lungCAM classifier is then fed with a smaller number of false positive findings and performs very well, bringing the overall sensitivity to the level of other CAD systems.
Since no publication analyzing the full LIDC/IDRI dataset (1018 scans) could be found, the lungCAM (and M5L) results cannot be compared to other methods under the same conditions.
Taking into account that the Gold Standard condition is defined as the consensus of at least two radiologists out of four (i.e., the less restrictive possible condition), that the algorithm was not optimized on the validation dataset, the M5L performance (∼80% at 6 FP/scan) is considered satisfactory.
Some other CAD systems report sensitivities larger than 80%, but those results were obtained on smaller datasets and should probably be confirmed in a configuration closer to the actual clinical/screening operating conditions.
The M5L main limitation affecting the sensitivity lies in the segmentation and filtering stage, where most of the findings, corresponding mainly to low intensity GGOs and subtle nodules (9.5% and 5.5% of the sensitivity loss, respectively), are missed. The remaining missing structures, accounting for about 4% of the sensitivity, are typically rejected in the classification stage. The development of dedicated optimized modules for the segmentation of GGOs and subtle structures is therefore the main task that could provide a significant improvement. The optimization of the neural-network classifier is also likely to allow a slight improvement on the sensitivity and a better rejection of the false positive findings, with a shift to the left of the FROC. A larger training dataset could also be used to improve the representation of every type of nodule and therefore the NN performance.
The sensitivity could also be further improved by extending the concept of subsystem result combination to other algorithms, even developed by other research groups, as long as their results are compliant with a fairly simple standard format for the CAD findings. and integrating them in the final combination module.
However, a FP/scan value in the 4–8 range is commonly accepted by radiologists, as long as a quick browsing of the CAD results is possible to minimize the FP rejection time. In parallel, a clinical validation is planned, where the M5L impact on the radiologist performance will be assessed: the gold standard obtained by the revision of the radiologist initial annotation based on the M5L results will be compared to the initial result by the radiologist and M5L alone.
6. CONCLUSIONS
The M5L lungCAM subsystem includes two new modules, providing
-
•
the identification of nodules connected to internal lung structures;
-
•
the equalization of CT scans, that allows the use of a common filtering function based on the correlation between the candidate nodule Sphericity and Radius.
The above discussed results show that the M5L performance on a large and heterogeneous dataset is stable and satisfactory, although the development of a dedicated module for ground glass opacities and subtle nodules detection could further improve it. An iterative optimization of the training procedure, which would be possible when increasing the gold standard dataset to be analyzed, would also likely provide a better false positive rejection.
The main aim of the present study, which was to verify to what extent the M5L results changed when progressively increasing the dataset size, was accomplished.
The performance is also independent of the input dataset, a feature that is rarely addressed in the literature: very similar results are obtained on LIDC/IDRI, ANODE09, and ITALUNG-CT scans.
The lungCAM overall performance is comparable and sometimes better than that of other systems that were optimized on large and validated on small datasets, as opposite to our strategy.
Excellent results are obtained when combining M5L to other systems, such as IsiCAD and FlyerScan: a multithread CAD system based on the combination of several algorithms, which could be made available thanks to WEB and cloud-based services, is indeed likely to perform on standards that are compatible with those of an experienced radiologist and would therefore provide a remarkable added value when used to support radiologists in clinical practice and screening programs.
ACKNOWLEDGMENTS
The authors acknowledge the National Cancer Institute and the Foundation for the National Institutes of Health and their role in the creation of the free publicly available LIDC/IDRI database used in this study. Thanks are due to Dr. F. Falaschi, Dr. C. Spinelli, and Dr. A. De Liperi (U.O. Radiodiagnostica 2, Azienda Ospedaliera Universitaria Pisana, Pisa, Italy) for making available the dataset from the ITALUNG-CT trial. The invaluable ANODE09 dataset with the associated radiologists annotations is available thanks to the ANODE09 team, in particular Professor Bram van Ginneken who also compared the M5L results with the ANODE09 annotations and provided the corresponding FROC curves.
REFERENCES
- 1.Parkin D., Ferlay J., Shin H., Bray F., Forman D., and Mathers C., “Estimates of worldwide burden of cancer in 2008,” Int. J. Cancer 127, 2893–2917 (2010). 10.1002/ijc.25516 [DOI] [PubMed] [Google Scholar]
- 2.American Cancer Society, “Cancer Facts and Figures,” http://www.cancer.org/Research/CancerFactsFigures (2009).
- 3.Diederich S., Lentschig M., Overbeck T., Wormanns D., and Heindel W., “Detection of pulmonary nodules at spiral CT: Comparison of maximum intensity projection sliding slabs and single-image reporting,” Eur. Radiol. 11, 1345–1350 (2001). 10.1007/s003300000787 [DOI] [PubMed] [Google Scholar]
- 4.van Iersel C. A., de Koning H. J., Draisma G., Mali W. P. T. M., Scholten E. T., Nackaerts K., Prokop M., Habbema J. D. F., Oudkerk M., and van Klaveren R. J., “Risk-based selection from the general population in a screening trial: Selection criteria, recruitment and power for the dutch-belgian randomised lung cancer multi-slice CT screening trial (NELSON),” Int. J. Cancer 120, 868–874 (2007). 10.1002/ijc.22134 [DOI] [PubMed] [Google Scholar]
- 5.Pegna A. L., Picozzi G., Mascalchi M., Carozzi F. M., Carrozzi L., Comin C., Spinelli C., Falaschi F., Grazzini M., Innocenti F., Ronchi C., and Paci E., “Design, recruitment and baseline results of the ITALUNG trial for lung cancer screening with low-dose CT,” Lung Cancer 64, 34–40 (2009). 10.1016/j.lungcan.2008.07.003 [DOI] [PubMed] [Google Scholar]
- 6.National Lung Screening Trial Research Team, Aberle D., Berg C., Black W., Church T., Fagerstrom R., Galen B., Gareen I., Gatsonis C., Goldin J., Gohagan J., Hillman B., Jaffe C., Kramer B., Lynch D., Marcus P., Schnall M., Sullivan D., Sullivan D., and Zylak C., “The national lung screening trial: Overview and study design,” Radiology 258, 243–253 (2011). 10.1148/radiol.10091808 [DOI] [PMC free article] [PubMed] [Google Scholar]
- 7.National Lung Screening Trial Research Team, Aberle D. R., Adams A. M., Berg C. D., Black W. C., Fagerstrom R. M., Gareen I. F., Gatsonis C., Marcus P. M., and Sicks J. D., “Reduced lung-cancer mortality with low-dose computed tomographic screening,” N. Engl. J. Med. 365, 395–409 (2011). 10.1056/NEJMoa1102873 [DOI] [PMC free article] [PubMed] [Google Scholar]
- 8.Roberts H., Patsios D., Kucharczyk D., Paul N., and Roberts T., “The utility of computer-aided detection (CAD) for lung cancer screening using low-dose CT,” in International Congress Series, Proceedings of the 19th International Congress and Exhibition (CARS 2005, Berlin, 2005), pp. 1137–1142. [Google Scholar]
- 9.Das M., Mühlenbruch G., Mahnken A., Flohr T., Gündel L., Stanzel S., Kraus T., Günthe R. W., and Wildberger J., “Small pulmonary nodules: Effect of two computer-aided detection systems on radiologist performance,” Radiology 241, 564–571 (2006). 10.1148/radiol.2412051139 [DOI] [PubMed] [Google Scholar]
- 10.Brochu B., Beigelman-Aubry C., Goldmard J., Raffy P., Grenier P., and Lucidarme O., “Computer-aided detection of lung nodules on thin collimation MDCT: Impact on radiologistsp´erformance,” J. Radiol. 88, 573–578 (2007). 10.1016/S0221-0363(07)89857-X [DOI] [PubMed] [Google Scholar]
- 11.Matsumoto S., Ohno Y., Yamagata H., Takenaka D., and Sugimura K., “Computer-aided detection of lung nodules on multidetector row computed tomography using three-dimensional analysis of nodule candidates and their surroundings,” Radiat. Med. 26, 562–569 (2008). 10.1007/s11604-008-0272-5 [DOI] [PubMed] [Google Scholar]
- 12.Brown M. S., Goldin J. G., Rogers S., Kim H. J., Suh R. D., McNitt-Gray M. F., Shah S. K., Truong D., Brown K., Sayre J. W., Gjertson D. W., Batra P., and Aberle D. R., “Computer-aided lung nodule detection in CT: Results of large-scale observer test1,” Acad. Radiol. 12, 681–686 (2005). 10.1016/j.acra.2005.02.041 [DOI] [PubMed] [Google Scholar]
- 13.Sahiner B., Chan H.-P., Hadjiiski L. M., Cascade P. N., Kazerooni E. A., Chughtai A. R., Poopat C., Song T., Frank L., Stojanovska J., and Attili A., “Effect of CAD on radiologists’ detection of lung nodules on thoracic CT scans: Analysis of an observer performance study by nodule size,” Acad. Radiol. 16, 1518–1530 (2009). 10.1016/j.acra.2009.08.006 [DOI] [PMC free article] [PubMed] [Google Scholar]
- 14.Retico A., Delogu P., Fantacci M. E., Gori I., and Martinez A. P., “Lung nodule detection in low-dose and thin-slice computed tomography,” Comput. Biol. Med. 38, 525–534 (2008). 10.1016/j.compbiomed.2008.02.001 [DOI] [PubMed] [Google Scholar]
- 15.Retico A., Fantacci M. E., Gori I., Kasae P., Golosio B., Piccioli A., Cerello P., Nunzio G. D., and Tangaro S., “Pleural nodule identification in low-dose and thin-slice lung computed tomography,” Comput. Biol. Med. 39, 1137–1144 (2009). 10.1016/j.compbiomed.2009.10.005 [DOI] [PubMed] [Google Scholar]
- 16.Armato S. G. III, McLennan G., Bidaut L., McNitt-Gray M. F., Meyer C. R., Reeves A. P., Zhao B., Aberle D. R., Henschke C. I., Hoffman E. A., Kazerooni E. A., MacMahon H., van Beek E. J. R., Yankelevitz D., Biancardi A. M., Bland P. H., Brown M. S., Engelmann R. M., Laderach G. E., Max D., Pais R. C., Qing D. P.-Y., Roberts R. Y., Smith A. R., Starkey A., Batra P., and Caligiuri P., “The lung image database consortium (LIDC) and image database resource initiative (IDRI): A completed reference database of lung nodules on CT scans,” Med. Phys. 38, 915–931 (2011). 10.1118/1.3528204 [DOI] [PMC free article] [PubMed] [Google Scholar]
- 17.van Ginneken B., Armato S. G. III, de Hoop B., van Amelsvoort-van de Vorst S., Duindam T., Niemeijer M., Murphy K., Schilham A., Retico A., Fantacci M. E., Camarlinghi N., Bagagli F., Gori I., Hara T., Fujita H., Gargano G., Bellotti R., Tangaro S., Bolanos L., Carlo F. D., Cerello P., Cheran S. C., Torres E. L., and Prokop M., “Comparing and combining algorithms for computer-aided detection of pulmonary nodules in computed tomography scans: The ANODE09 study,” Med. Image Anal. 14, 707–722 (2010). 10.1016/j.media.2010.05.005 [DOI] [PubMed] [Google Scholar]
- 18.Camarlinghi N., Gori I., Retico A., Bellotti R., Bosco P., Cerello P., Gargano G., Torres E. L., Megna R., Peccarisi M., and Fantacci M. E., “Combination of computer-aided detection algorithms for automatic lung nodule identification,” Int. J. Comput. Assisted Radiol. Surg. 7, 455–464 (2012). 10.1007/s11548-011-0637-6 [DOI] [PubMed] [Google Scholar]
- 19.Bellotti R., Cerello P., Tangaro S., Bevilacqua V., Castellano M., Mastronardi G., Carlo F. D., Bagnasco S., Bottigli U., Cataldo R., Catanzariti E., Cheran S. C., Delogu P., Mitri I. D., Nunzio G. D., Fantacci M. E., Fauci F., Gargano G., Golosio B., Indovina P. L., Lauria A., Torres E. L., Magro R., Masala G. L., Massafra R., Oliva P., and Martinez A. P., “Distributed medical images analysis on a grid infrastructure,” Future Gener. Comput. Syst. 23, 475–484 (2007). 10.1016/j.future.2006.07.006 [DOI] [Google Scholar]
- 20.Bellotti R., Carlo F. D., Gargano G., Tangaro S., Cascio D., Catanzariti E., Cerello P., Cheran S. C., Delogu P., Mitri I. D., Fulcheri C., Grosso D., Retico A., Squarcia S., Tommasi E., and Golosio B., “A CAD system for nodule detection in low-dose lung CTs based on region growing and a new active contour model,” Med. Phys. 34, 4901–4910 (2007). 10.1118/1.2804720 [DOI] [PubMed] [Google Scholar]
- 21.Savitzky A. and Golay M. J. E., “Smoothing and differentiation of data by simplified least squares procedures,” Anal. Chem. 36, 1627–1639 (1964). 10.1021/ac60214a047 [DOI] [Google Scholar]
- 22.Rajagopalan S. and Robb R. A., “Image smoothing with Savtizky-Golay filters,” Proc. SPIE 5029, 773–781 (2003). 10.1117/12.479596 [DOI] [Google Scholar]
- 23.Nunzio G. D., Tommasi E., Agrusti A., Cataldo R., Mitri I. D., Favetta M., Maglio S., Massafra A., Quarta M., Torsello M., Zecca I., Bellotti R., Tangaro S., Calvini P., Camarlinghi N., Falaschi F., Cerello P., and Oliva P., “Automatic lung segmentation in CT images with accurate handling of the hilar region,” J. Digital Imaging 24, 11–27 (2011). 10.1007/s10278-009-9229-1 [DOI] [PMC free article] [PubMed] [Google Scholar]
- 24.Cerello P., Cheran S. C., Bagnasco S., Bellotti R., Bolanos L., Catanzariti E., Nunzio G. D., Fantacci M. E., Fiorina E., Gargano G., Gemme G., Torres E. L., Masala G. L., Peroni C., and Santoro M., “3-D object segmentation using ant colonies,” Pattern Recognit. 43, 1476–1490 (2010). 10.1016/j.patcog.2009.10.007 [DOI] [Google Scholar]
- 25.Messay T., Hardie R. C., and Rogers S. K., “A new computationally efficient CAD system for pulmonary nodule detection in CT imagery,” Med. Image Anal. 14, 390–406 (2010). 10.1016/j.media.2010.02.004 [DOI] [PubMed] [Google Scholar]
- 26.Lee S. L. A., Kouzani A. Z., and Hu E. J., “Automated detection of lung nodules in computed tomography images: A review,” Mach. Vision Appl. 23, 151–163 (2012). 10.1007/s00138-010-0271-2 [DOI] [Google Scholar]
- 27.Pheng H. S., Shamsuddin S. M., and Kenji S., “Application of intelligent computational models on computed tomography lung images,” Int. J. Adv. Soft Comput. Appl. 3, 1–15 (2011). [Google Scholar]
- 28.Tan M., Deklerck R., Jansen B., Bister M., and Cornelis J., “A novel computer-aided lung nodule detection system for ct images,” Med. Phys. 38, 5630–5645 (2011). 10.1118/1.3633941 [DOI] [PubMed] [Google Scholar]
- 29.Golosio B., Masala G. L., Piccioli A., Oliva P., Carpinelli M., Cataldo R., Cerello P., De Carlo F., Falaschi F., Fantacci M. E., Gargano G., Kasae P., and Torsello M., “A novel multithreshold method for nodule detection in lung ct,” Med. Phys. 36, 3607–3618 (2009). 10.1118/1.3160107 [DOI] [PubMed] [Google Scholar]
- 30.Guo W. and Li Q., “High performance lung nodule detection schemes in ct using local and global information,” Med. Phys. 39, 5157–5168 (2012). 10.1118/1.4737109 [DOI] [PMC free article] [PubMed] [Google Scholar]
- 31.Brown M., Lo P., Goldin J., Barnoy E., Kim G., McNitt-Gray M., and Aberle D., “Toward clinically usable cad for lung cancer screening with computed tomography,” Eur. Radiol. 24, 2719–2728 (2014). 10.1007/s00330-014-3329-0 [DOI] [PubMed] [Google Scholar]
- 32.Murphy K., van Ginneken B., Schilham A. M. R., de Hoop B. J., Gietema H. A., and Prokop M., “A large-scale evaluation of automatic pulmonary nodule detection in chest CT using local image features and k-nearest-neighbour classification,” Med. Image Anal. 13, 757–770 (2009), includes Special Section on the 12th International Conference on Medical Imaging and Computer Assisted Intervention. 10.1016/j.media.2009.07.001 [DOI] [PubMed] [Google Scholar]
- 33.Godoy M., Cooperberg P., Maizlin Z., Yuan R., McWilliams A., Lam S., and Mayo J., “Detection sensitivity of a commercial lung nodule cad system in a series of pathologically proven lung cancers,” J. Thorac. Imaging 23, 1–6 (2008). 10.1097/RTI.0b013e3181339edb [DOI] [PubMed] [Google Scholar]
- 34.R2 Technology, Inc., “Understanding the Imagechecker CT Lung System” (PN 13229 Rev A Hologic, Inc., 35 Crosby Drive, Bedford, MA 01730-01401, 2005). [Google Scholar]
- 35.ANODE09 challenge organizers (personal communication, 2014).


