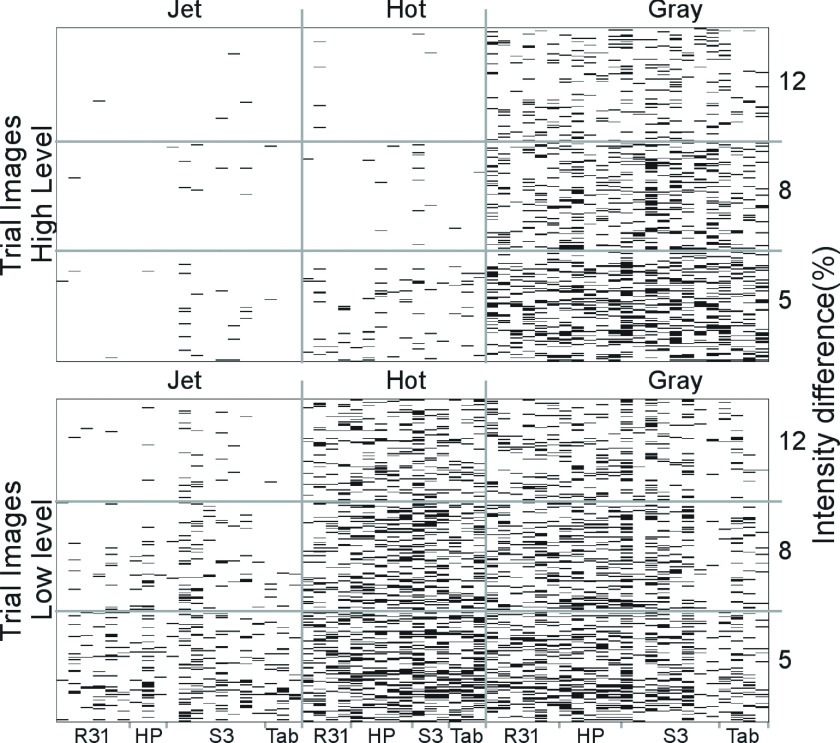
FIG. 8.
Comprehensive set of all the experiment results. White represents correct answers and black wrong answers. Each column represents a reader session. The device and the color scale used are in the x and x2 axes labels, respectively. Each row represents a 2AFC trial, in ascending order of intensity difference (represented by alpha in the y2 axis). Performance in high level (top) and low level (bottom) are plotted separately. The number of readers per device and color scale combination varies.

