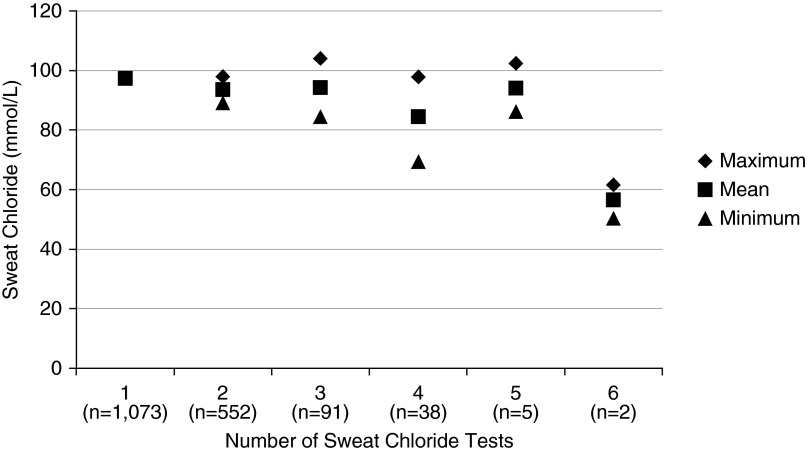
Figure 1.
Maximum, mean, and minimum sweat chloride values by number of tests performed for a subject. The average maximum value for subjects with more than one measurement was not different than the average measurement for subjects with only one measurement as opposed to the average mean or minimum values for subjects with more than one measurement, thus illustrating a potential bias to record maximum measurements preferentially.

