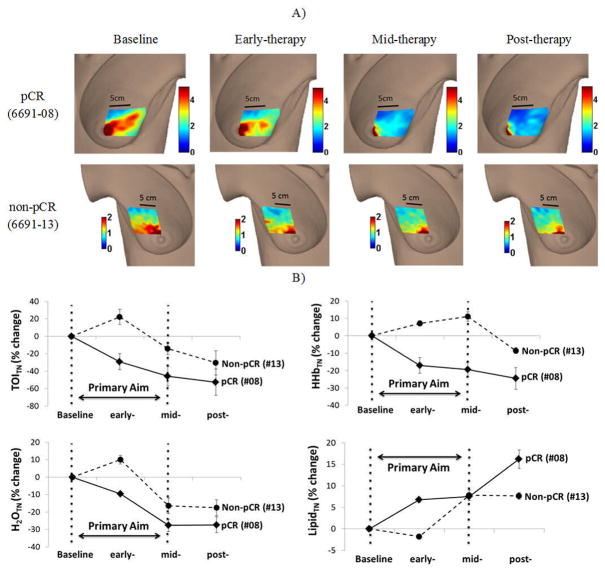
Figure 3.
DOSI Images throughout NAC for a pCR (6691-08) and a non-pCR (6691-13) subject. Scale bar illustrates Tissue Optical Index (TOI) values. B) Percent change in TOITN, HHbTN, H2OTN, LipidTN from baseline for both subjects. Error bars represent the SD of multiple measurement locations defined by the ROI for each subject (25 and 28 locations for 6691-08 and 6691-13, respectively).

