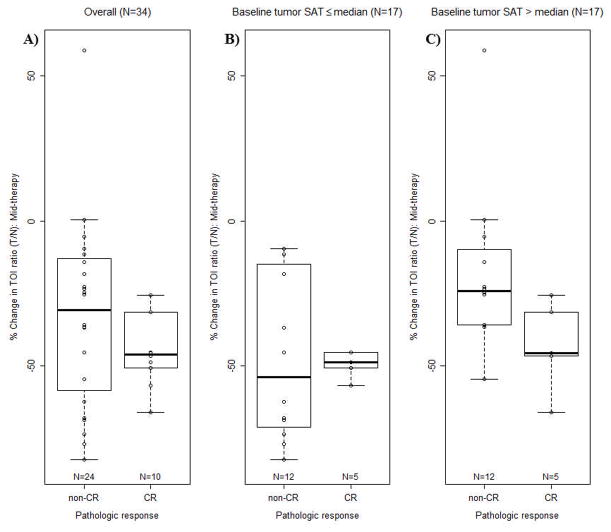
Figure 4.
Boxplot of percent change from baseline to mid-therapy in TOITN (%TOITN) by final pathologic status, dichotomized as pCR vs. non-pCR. A) in the overall evaluable dataset; B) in the subset of evaluable cases with baseline tumor oxygenation lower than the median value; C) in the subset of evaluable cases with baseline tumor oxygenation greater than the median value.

