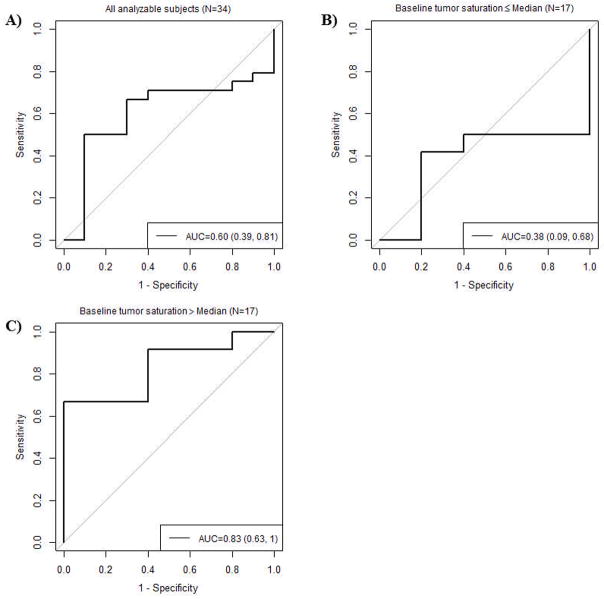
Figure 5.
ROC curves for pathologic complete response using percent change from baseline to mid-therapy in TOITN (%TOITN) A) in the overall evaluable dataset, B) in the subset of evaluable cases with baseline tumor saturation lower than the median value, C) in the subset of evaluable cases with baseline tumor saturation greater than the median value. The reference standard is coded as follows: 0=pCR and 1=Non-pCR.

