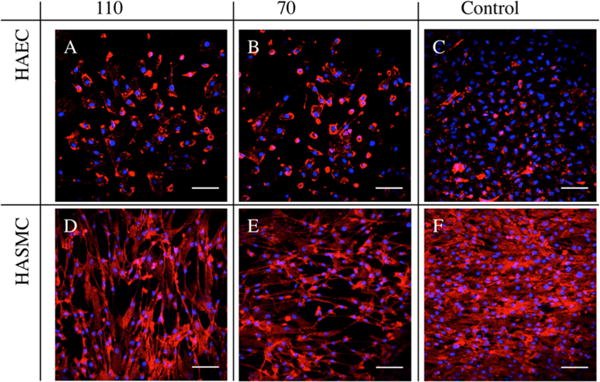
Figure 2.

Immunofluorescent images of 7 day culture of (A–C) HAEC and (D–F) HASMC on 110, 70, and Control. Cells were nuclei-stained with DAPI and F-actin-stained with TRITC-Phalloidin (represented as blue and red, respectively). Scale bars are 50 μm. HAEC were observed to demonstrate increased cell spreading on (A) 110 and (B) 70 and were less confluent than Control (C). HASMC were well-aligned and observed to be more confluent on (F) Control than on (D) 110 and (E) 70.
