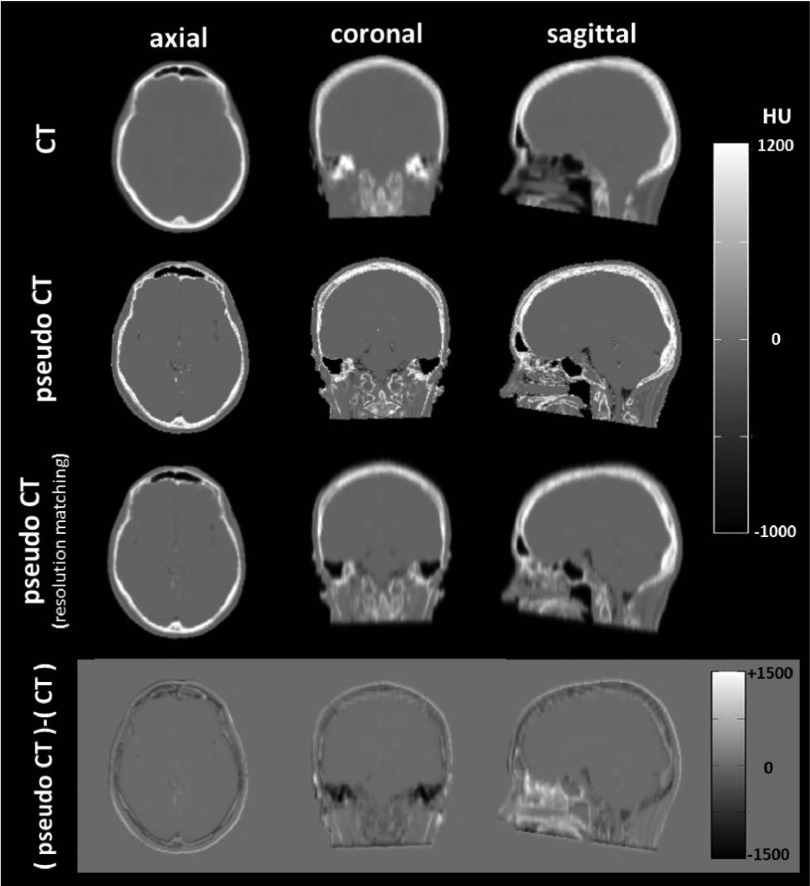
FIG. 5.
CT versus pseudo-CT. The measured CT images (reference) are shown in the top row. The second and third rows are the pseudo-CT images and the pseudo-CT images with resolution matching filtering. The bottom images show the differences between the resolution-matched pseudo-CT and the measured CT. For comparison, the pseudo-CTs are cropped to match the FOV of the measured CT.

