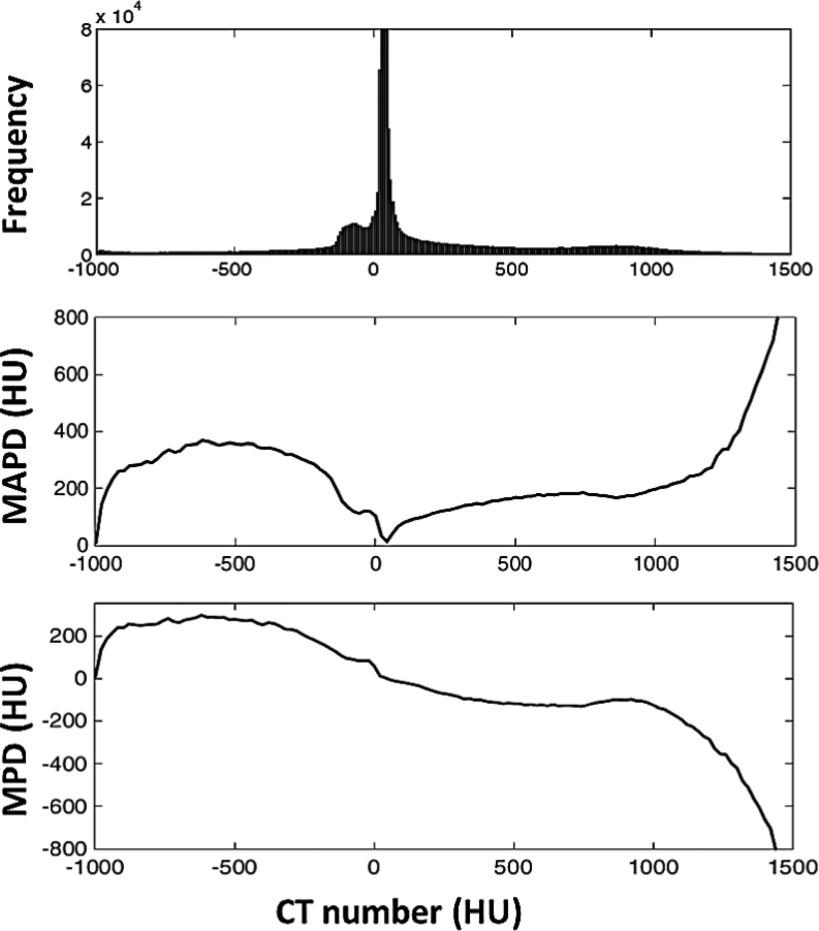
FIG. 6.
A comparison between the voxel HU values of the pseudo-CT and those of the measured CT. The upper plot shows a frequency histogram of the pixel values in the measured CT, while the middle and lower plots show the mean absolute prediction deviation (MAPD) and mean prediction deviation (MPD). Although the MAPD has peaks at approximately −600 and 1400 HU and thus indicating high-magnitude errors, the histogram indicates that there are very few pixels, i.e., less than 0.1% and 0.01%, respectively, of the total number of voxels having these errors.

