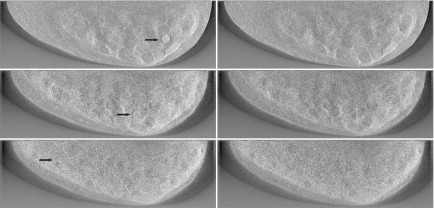
FIG. 2.
Example study images showing the impact of phantom VGP. From top to bottom, the left-hand column shows abnormal cases with 25%, 50%, and 75% VGP, respectively. The lesion in each image is indicated by the arrow. The corresponding normal images are shown at right. All images were generated from acquisitions with P = 25.

