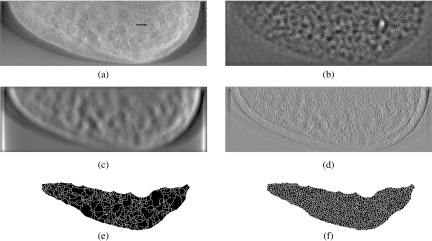
FIG. 5.
Correlation-map calculations for the VS observers. (a) A lesion-present, mid-density test image. The lesion is indicated by the arrow. (b) CNPW correlation map; (c) MF correlation map; (d) GMF correlation map; (e) Watershed segmentation of the MF map; (f) Watershed segmentation of the GMF map. The dark regions in the segmentation images represent the watershed supports and the white lines are the watershed boundaries.

