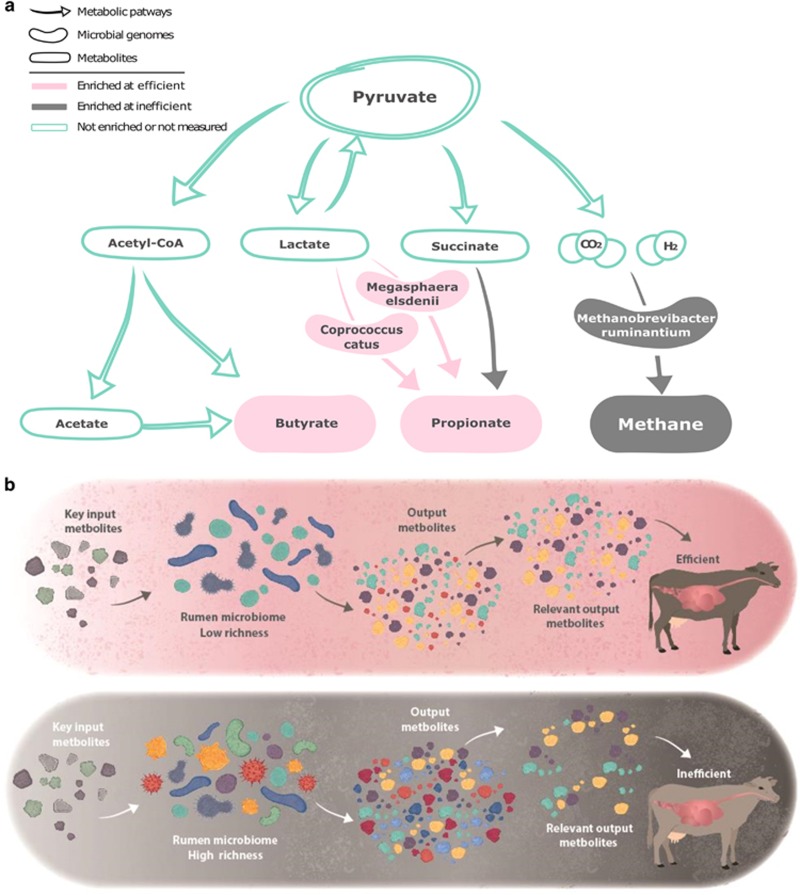
Figure 7.
Consolidated results and model. (a) Consolidation of results from the metabolomics, genome and pathway recruitment analyses. Green: pathways and metabolites that were not significantly different or that were not assessed. Pink: enriched in efficient microbiomes. Grey: enriched in inefficient microbiomes. (b) Proposed model. From left to right: identical key input metabolites are ingested by the cow and presented to either an efficient microbiome (top panel) with lower richness and diversity, or an inefficient microbiome (bottom panel) with higher richness and diversity. Differences in richness result in the production of different metabolites. The efficient microbiome produces a smaller range of output metabolites than the inefficient microbiome, however, with larger amounts of relevant output metabolites, which are available for the animal's energetic needs.

