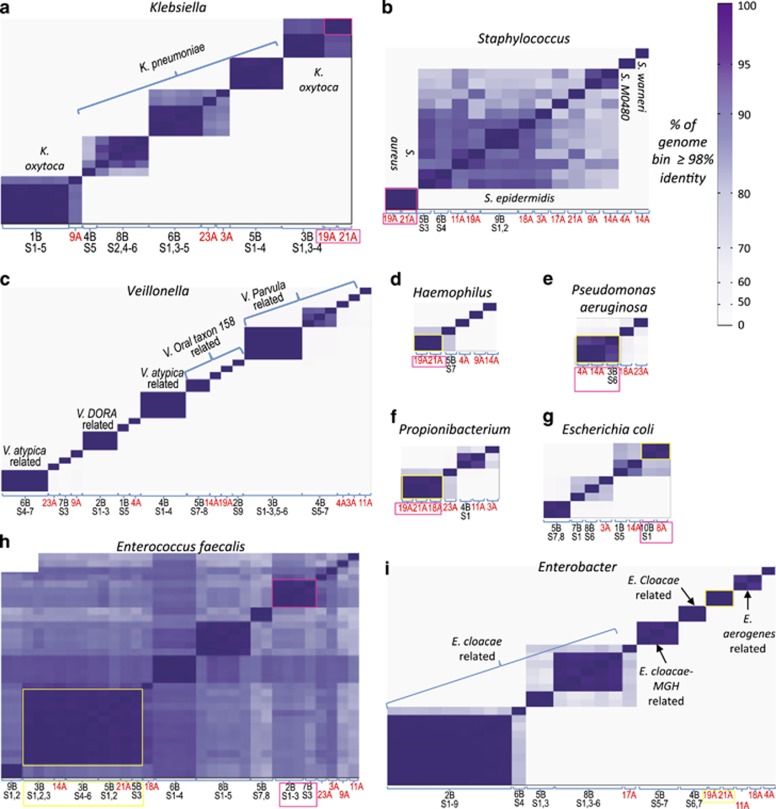
Figure 2.
Pairwise similarity of high-quality genomes. Each column on the x axis (and each row on the y axis) represents a reconstructed genome from the taxonomic group showed in each panel. The intensity of color in cell (i, j) of the matrix corresponds to the similarity of genome i and genome j, where similarity was defined to be the fraction of genome length, that is, >98% identity. For each scaffold, the number of basepairs contained in alignments with >98% identity were counted. Strains where >95% of total genome basepairs were >98% identical, were considered as belonging to the same 'strain type'. The ordering of genomes is the same on the x and y axis and was determined by clustering the genomes according to their similarity to all other genomes. Strain types that were recovered from more than one infant are highlighted with boxes. X axis shows Infant number (and samples number for the 2014 cohort) from which the corresponding genome was recovered. Genomes recovered from the 2011–2012 cohort are marked with red font. (a–h) comparisons of strains of (a) Klebsiella (b) Staphylococcus (c) Veillonella (d) Haemophilus (e) Pseudomonas aeruginosa (f) Propionibacterium (g) Escherichia coli (h) Enterococcus (i) Enterobacter.

