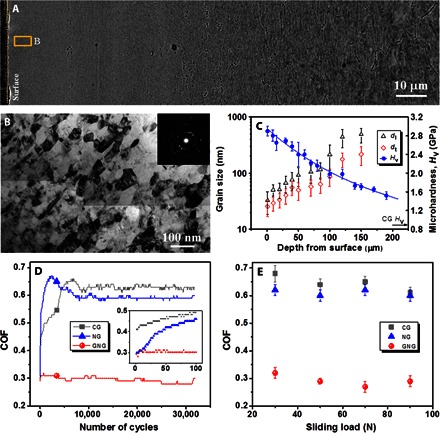
Fig. 1. GNG structure and COF in the Cu-Ag sample.

(A) Typical longitudinal-sectional scanning electron microscopy image of the as-prepared GNG Cu-Ag sample. (B) Bright-field TEM image about 3 μm below the surface in (A); inset shows a corresponding electron diffraction pattern. (C) Variation of longitudinal (dl) and transversal grain sizes (dt) and microhardness along depth from the surface. Error bars represent the SD of grain size and hardness measurements. (D) Variation of COFs with sliding cycles for the CG, NG, and GNG Cu-Ag samples sliding against WC-Co balls under a load of 50 N, a slide stroke of 1 mm, and a velocity of 10 mm/s. Inset shows COFs during the initial 100 cycles. (E) Variations of the steady-state COFs with the applied load for the three samples.
