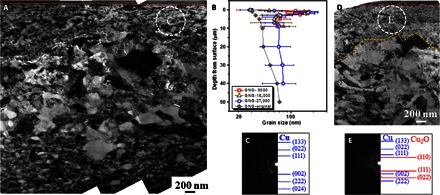
Fig. 4. Friction-induced subsurface microstructure evolution.

(A) Typical cross-sectional TEM image of the subsurface layer in the GNG sample after sliding for 27,000 cycles. (B) Variation of the mean grain sizes along the depth determined from TEM images in the GNG samples before and after sliding for 9000, 18,000, and 27,000 cycles, respectively. (C) Corresponding electron diffraction pattern in the topmost surface layers [as indicated in (A)]. (D) Typical cross-sectional TEM image of the subsurface layer in the NG samples after sliding for 18,000 cycles. (E) Corresponding electron diffraction pattern in the topmost surface layers [as indicated in (D)]. Sliding surfaces are outlined by dash-dotted lines, and the tribolayer/recrystallization interfaces by dashed lines. A load of 50 N, a slide stroke of 1 mm, and a velocity of 10 mm/s were applied for each sample.
