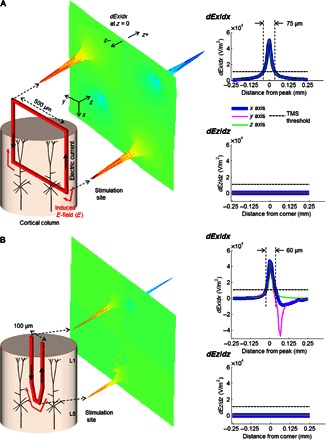
Fig. 1. Micrometer-sized microcoils generate suprathreshold fields.

(A) Surface (middle) plot of the electric field gradients in the x direction (dEx/dx) arising from the 500-μm square coil on the left (red). Note that the horizontally oriented peaks in the surface plot indicate the peak gradients in a direction normal to the cortical surface, that is, up and down in the cortical column representation on the left. Right: Two-dimensional profile of the gradients in the vertical (dEx/dx, top) and horizontal (dEz/dz, bottom) directions; the “0” on the abscissa corresponds to the bottom right corner of the coil. The horizontal lines indicate estimated threshold levels from earlier studies with much larger coils (see text). Dashed vertical lines indicate the width of the suprathreshold region. (B) Similar to (A), except for a 100-μm trapezoidal coil.
