
Figure 3.
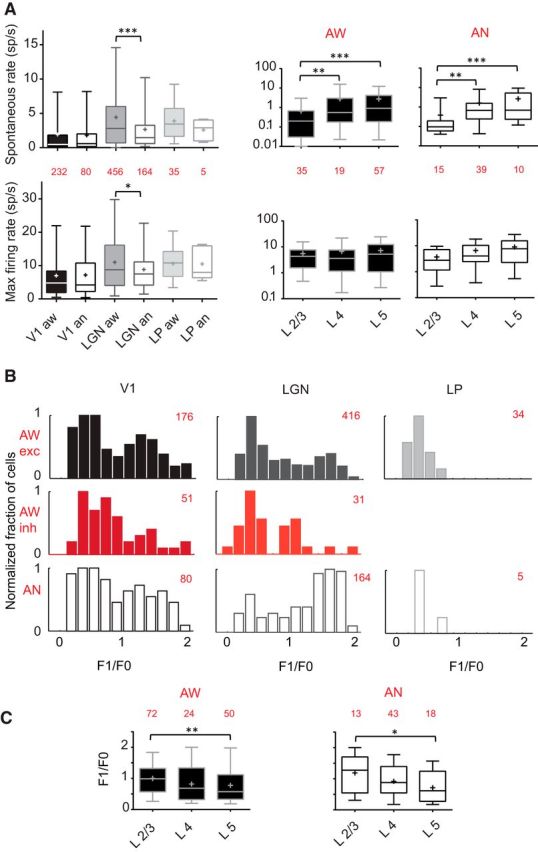
State effect on firing rates and linearity in V1, dLGN, and LP. A, First column, Mean spontaneous and maximum evoked firing rates for the 3 areas and 2 states. Red represents the number of cells recorded for each condition. Box plots represent medians as a bar, mean as a cross, and illustrate 5th and 95th percentiles. Under anesthesia, spontaneous rate decreases only in dLGN (Mann–Whitney test, p = 0.0003). Maximum evoked firing rate is not showing statistical dependence on state in V1 and LP, but it is in dLGN (Mann-Whitney test, p = 0.03). Second and third columns, Firing rates by layer. Low spontaneous firing rate is seen in L2/3 in both states: Mann–Whitney test, L2/3 vs L4, p = 0.0043 (aw) and 0.0026 (an); L2/3 vs L5, p < 0.0001 (aw and an). Maximum firing rate levels do not vary with cortical layer and state: L2/3 vs L5: Kruskal–Wallis test, not significant (aw and an). B, F1/F0 index distributions in 3 areas. The number of units recorded are in red. Awareness does not alter spatial summation in V1 and LP. In dLGN, there is a significant shift toward more complex responses from anesthesia to awake state (solid gray; Mann–Whitney test, p < 0.0001). Few putative inhibitory cells (red) have a high value of F1/F0 ratio in V1 and dLGN. LP cells (light gray) are exclusively nonlinear. C, Distribution of F1/F0 index per cortical layers for all cells. In both states, L5 is the layer with the smallest mean of F1/F0 (Mann–Whitney test, aw: L2/3 vs L5: p = 0.0092; an: 0.0175). *, p < 0.05; **, p < 0.01; ***, p < 0.001.